The Future of B2B Content Marketing
B2B Content Marketing
What’s driving growth and setting businesses apart in today’s competitive B2B world? Content marketing. But the game is changing—fast. From lead generation struggles to proving ROI, businesses are navigating evolving tools, strategies, and goals. This report dives deep into these shifts, spotlighting AI-driven personalization, real-time optimization, and other transformative technologies reshaping the industry.
Drawing on insights from industry leaders across diverse roles, sectors, and company sizes, this report uncovers the goals, challenges, and emerging trends defining B2B content marketing today. It goes beyond theory to offer actionable advice and fresh perspectives, helping marketers and decision-makers refine strategies, allocate resources wisely, and achieve measurable results.
Whether you’re a marketer honing your approach or an executive aligning content efforts with broader business goals, this guide is your roadmap to staying ahead and thriving in a rapidly changing environment.
Key marketing goals and challenges
B2B organizations center their efforts on three critical marketing goals: lead generation, brand awareness, and sales support. These objectives reflect a dual focus—delivering measurable results while building trust and credibility in competitive markets. Yet, challenges persist. Many businesses grapple with generating high-quality leads, evaluating content effectiveness, and maintaining the in-house expertise needed to execute complex strategies.
Key Findings:
- Lead generation dominates: The top priority for respondents, lead generation, highlights the pressure on marketers to deliver measurable outcomes.
- Measuring ROI: Challenges in assessing content effectiveness remain a major obstacle, hindering strategy refinement and access to additional resources.
- Resource constraints: Many organizations struggle with limited internal expertise and bandwidth to meet the demands of evolving content marketing strategies.
Recommendations:
- Invest in analytics: Use advanced tools to track and measure content performance more effectively.
- Training and development: Offer continuous training to internal teams or bring external expertise to address skill gaps.
- Align sales and marketing: Encourage team collaboration to create more focused and impactful campaigns.
Next Steps:
- Conduct a content audit to pinpoint gaps in current strategies.
- Develop clear KPIs tied to specific goals, ensuring alignment across teams.
- Explore automation tools to boost efficiency and redirect resources toward strategic initiatives.
Confidence in ROI Measurement
Confidence in measuring ROI varies widely based on industry, role, and company size. Mid-sized organizations and IT professionals lead the way, driven by access to robust data tools and well-integrated systems. On the other hand, smaller companies and industries with limited resources face greater challenges, leading to lower confidence in their ability to measure ROI effectively.
Key Findings:
- Mid-sized companies lead: Organizations with 51–200 employees report the highest confidence in ROI measurement, benefiting from tools that balance cost-effectiveness and impact.
- IT professionals excel: Roles in IT and technology show a strong command of metrics, reflecting their expertise in implementing and managing analytics tools.
Recommendations:
- Adopt unified platforms: Use tools like HubSpot or Salesforce to simplify tracking and reporting.
- Integrate analytics early: Incorporate analytics into campaigns from the start to enable precise measurement.
- Cross-functional collaboration: Work with IT and finance teams to enhance ROI tracking and connect metrics to overarching business objectives.
Next Steps:
- Map out the current analytics stack and identify gaps.
- Pilot a reporting framework for a specific campaign to improve measurement techniques.
- Provide training sessions on ROI tracking for marketing and related teams.
Adoption of Emerging Technologies
Advanced automation and AI-powered personalization are quickly becoming priorities for organizations aiming to boost efficiency and deliver customized experiences. In contrast, technologies like blockchain for content transparency and voice search optimization see lower adoption rates, reflecting hesitation or limited relevance for many businesses.
Key Findings:
- High interest in automation: Automation tools top the list of technologies organizations are exploring, reflecting their potential to streamline processes.
- AI for personalization: AI-driven strategies are increasingly viewed as essential for engaging diverse audiences at scale.
- Low blockchain adoption: Despite its potential, blockchain adoption remains negligible, indicating skepticism about its immediate value in content marketing.
Recommendations:
- Prioritize high-impact technologies: Focus on tools that directly address pain points, such as lead generation or content distribution.
- Test emerging solutions: Pilot technologies like AI in controlled campaigns to evaluate their ROI before full-scale adoption.
- Monitor trends: Stay informed about developments in less-adopted technologies to anticipate future opportunities.
Next Steps:
- Allocate your budget for experimenting with AI and automation tools.
- Collaborate with technology providers to understand implementation best practices.
- Build a roadmap for phased adoption based on organizational needs and capabilities.
Willingness to Invest in Innovation
The willingness to invest in experimental content strategies varies widely across roles, industries, and company sizes. IT professionals, product managers, and mid-sized companies show the greatest enthusiasm for innovation, while smaller organizations and resource-limited roles often take a more cautious approach to experimentation.
Key Findings:
- Strong interest among IT roles: IT professionals consistently express a higher willingness to invest, reflecting their familiarity with emerging technologies.
- Mid-sized companies lead: These organizations balance agility and resource availability, making them prime candidates for innovation.
Recommendations:
- Highlight success stories: Showcase case studies from similar organizations to demonstrate investment benefits.
- Address barriers: Develop cost-effective solutions for smaller firms or roles with limited resources.
- Build incremental strategies: Encourage starting with small-scale experiments to reduce risk and build confidence.
Next Steps:
- Identify one or two high-priority innovations for immediate testing.
- Use pilot results to secure buy-in for broader implementation.
- Develop internal champions to lead innovation initiatives.
Qualitative Insights
Qualitative responses highlight the critical role of consistency, deep audience understanding, and strategic use of AI tools in driving content marketing success. However, respondents also point to ongoing challenges, such as limited time and resources, that often hinder the execution of ambitious strategies.
Key Findings:
- Consistency is key: Regular and high-quality content production is a recurring theme.
- Audience-centric approaches: Tailoring content to audience preferences is emphasized as a differentiator.
- Time constraints: Many respondents struggle to allocate sufficient time for content planning and execution.
Recommendations:
- Streamline content processes: Use AI and automation tools to reduce the time spent on repetitive tasks.
- Invest in audience research: Develop deeper audience personas to ensure content relevance and engagement.
- Encourage cross-functional support: Leverage teams across departments to share the workload and enrich content.
Next Steps:
- Audit current content workflows to identify inefficiencies.
- Implement tools like AI-based copywriting assistants or content calendars.
- Schedule regular audience feedback sessions to refine strategies.
Audience Profile: Who Participated in This Report
This report draws on insights from professionals spanning industries, company sizes, roles, and seniority levels, offering a comprehensive view of the ever-evolving world of B2B content marketing.
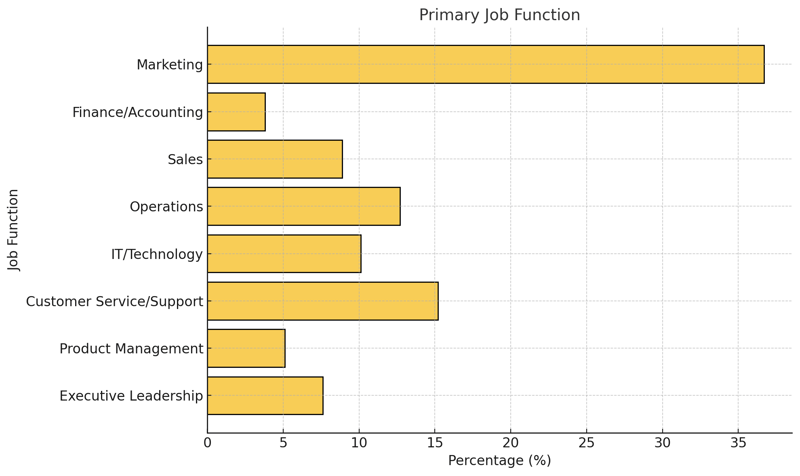
Respondents represent a broad spectrum of roles, with the largest group comprising marketing professionals (36.7%), reflecting the core audience driving content marketing strategies. Other notable functions include customer service/support (15.2%), operations (12.7%), and IT/technology (10.1%), highlighting the cross-functional nature of content marketing. Sales professionals account for 8.9%, while executive leadership (7.6%), product management (5.1%), and finance/accounting (3.8%) further diversify the respondent pool.
Seniority Levels
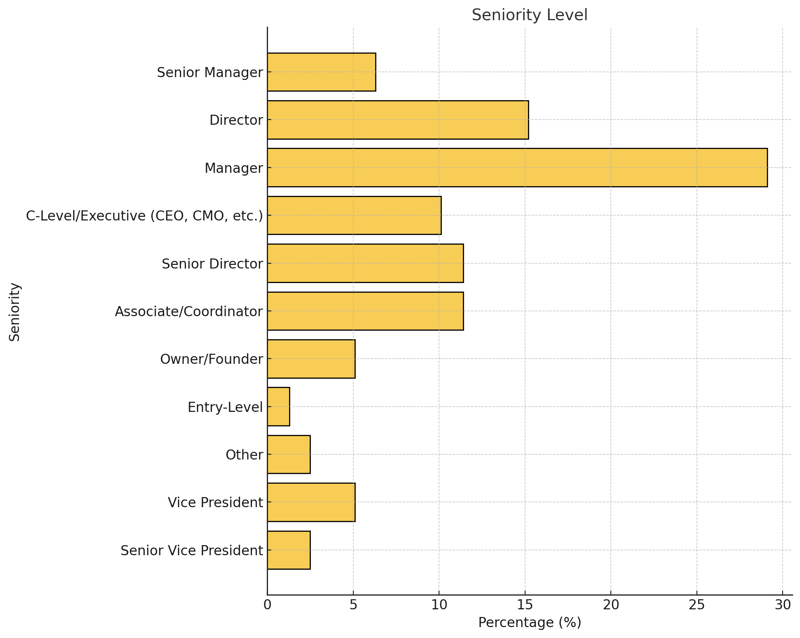
The survey includes perspectives from various levels of seniority, from entry-level professionals (1.3%) to C-level executives (10.1%) and owners/founders (5.1%), creating a well-rounded representation of decision-makers and practitioners. Managers (29.1%) form the largest segment, followed by directors (15.2%), senior directors (11.4%), and associate/coordinator roles (11.4%). Vice presidents and senior vice presidents collectively represent 7.6% of respondents, providing high-level strategic insights.
Company Size
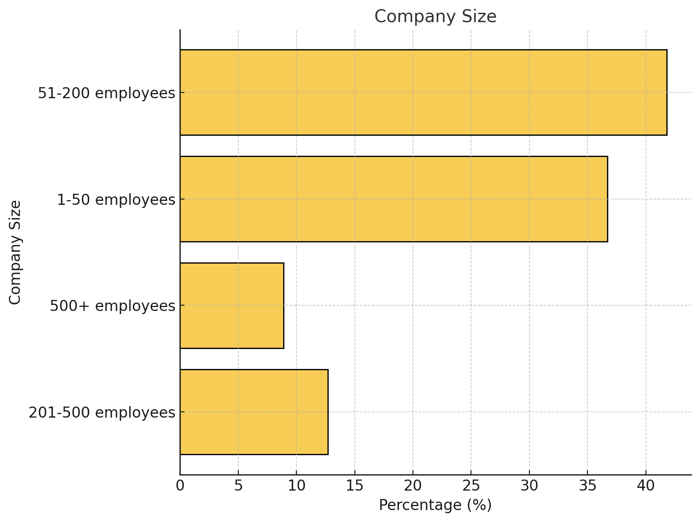
Participants come from companies of all sizes, with a significant portion working in mid-sized organizations. The largest groups include companies with 51-200 employees (41.8%) and 1-50 employees (36.7%), reflecting the agility and innovation often seen in smaller and mid-sized firms. Larger organizations are also represented, with 201-500 employees (12.7%) and 500+ employees (8.9%), contributing to a balanced perspective.
Industries
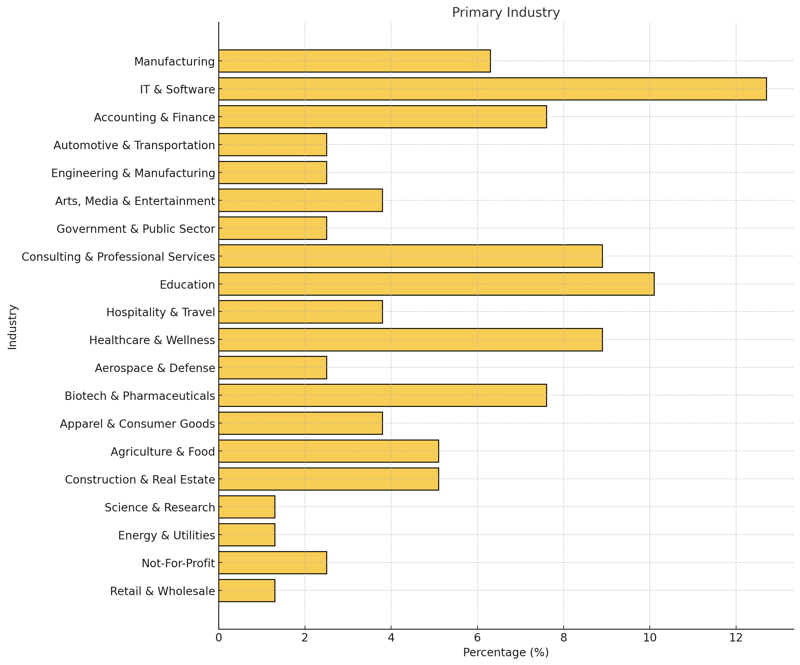
The industries represented span traditional and emerging sectors, reflecting the diverse applications of B2B content marketing. Leading sectors include IT & Software (12.7%), education (10.1%), and consulting & professional services (8.9%), as well as healthcare & wellness (8.9%) and biotech & pharmaceuticals (7.6%). Other notable industries include manufacturing (6.3%), accounting & finance (7.6%), and agriculture & food (5.1%). Emerging sectors like aerospace & defense (2.5%) and energy & utilities (1.3%) also bring unique perspectives to the report.
Summary of Findings
This diverse audience reflects the priorities, challenges, and aspirations of professionals across roles. From marketers developing creative strategies to executives aligning content with business objectives, these perspectives offer a well-rounded view of B2B content marketing today and in the future.
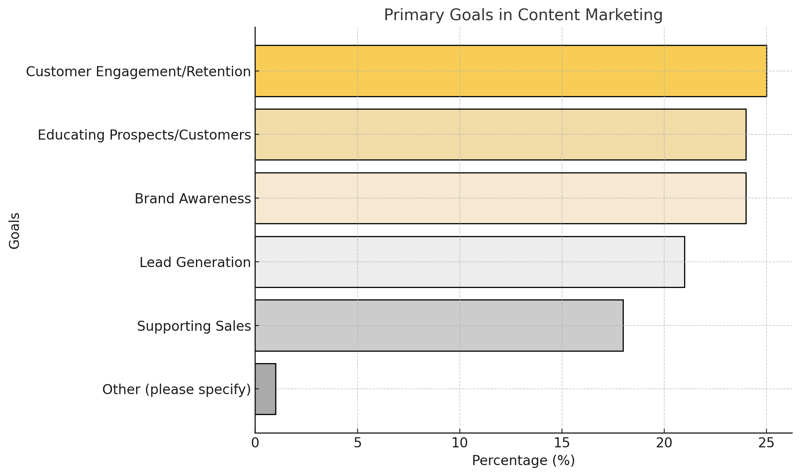
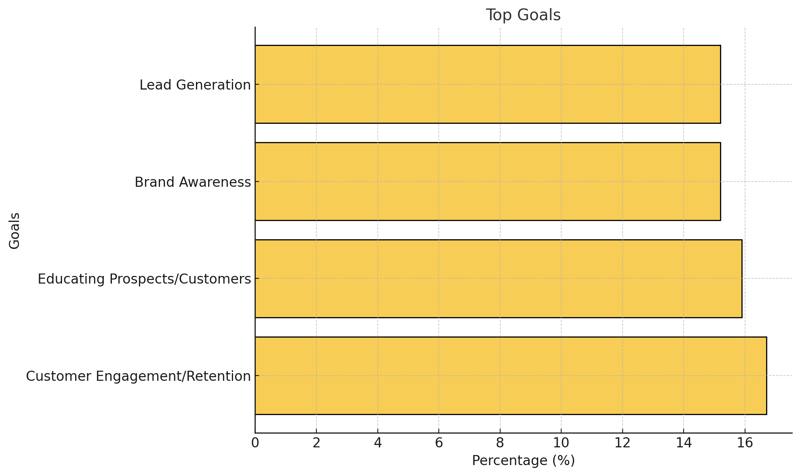
- Customer Engagement/Retention: 25%
- Educating Prospects/Customers: 24%
- Brand Awareness: 24%
- Lead Generation: 21%
- Supporting Sales: 18%
- Other (please specify): 1%
The primary goals for B2B content marketing efforts reveal a balanced approach across several priorities, with customer engagement/retention (25%) and educating prospects/customers (24%) narrowly leading the pack. These goals emphasize a shift toward relationship-building and value delivery, reflecting the broader industry trend of focusing on long-term customer relationships rather than solely on short-term sales gains. The results indicate that companies are increasingly leveraging content to deepen trust, foster loyalty, and guide customers through the buyer’s journey.
Interestingly, brand awareness (24%) remains a top goal, suggesting that despite the rise of targeted and personalized marketing, businesses still prioritize visibility in crowded markets. Lead generation (21%) follows closely, highlighting the enduring importance of capturing new opportunities while balancing other objectives. Meanwhile, supporting sales (18%) ranks lower, potentially indicating a disconnect between marketing and sales teams or a strategic shift toward nurturing prospects through non-salesy, value-driven content.
This diverse set of goals reflects the multifaceted role of content marketing today. It goes beyond filling the sales pipeline to fostering meaningful connections, educating audiences, and strengthening brand identity in an increasingly competitive B2B environment.
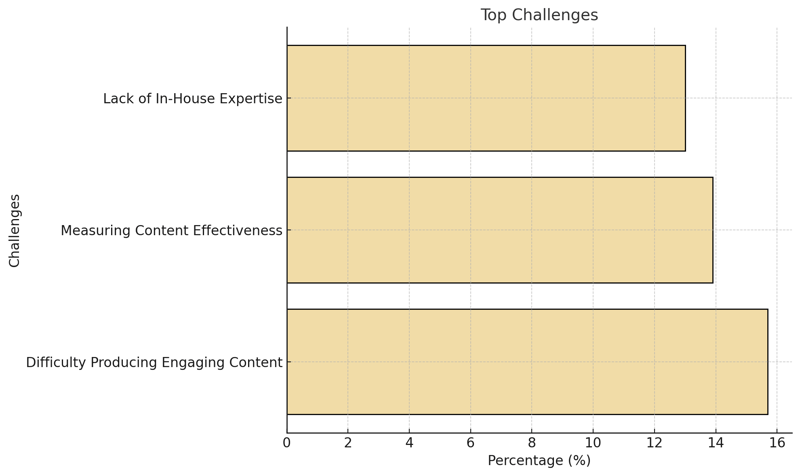
Top Challenges
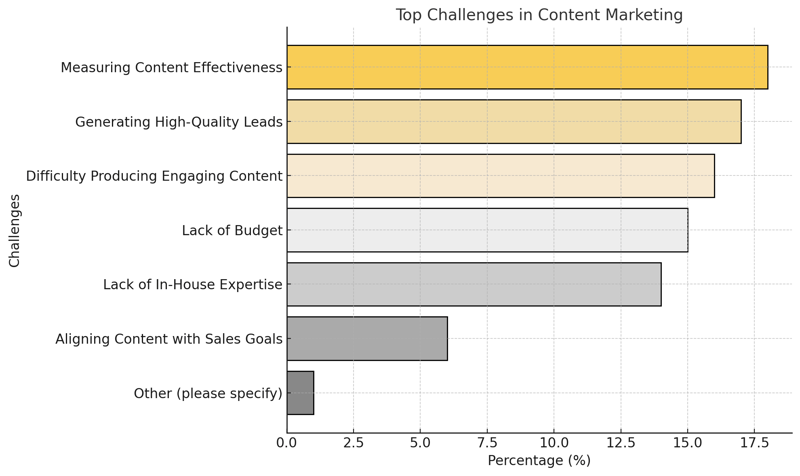
- Measuring Content Effectiveness: 18%
- Generating High-Quality Leads: 17%
- Difficulty Producing Engaging Content: 16%
- Lack of Budget: 15%
- Lack of In-House Expertise: 14%
- Aligning Content with Sales Goals: 6%
- Other (please specify): <1%
The top challenges facing B2B marketers are a reflection of both tactical and strategic obstacles. At the forefront is measuring content effectiveness (18%), which underscores a persistent issue: tying content performance to tangible business outcomes. This challenge suggests a gap in analytics capabilities or integration, with many marketers struggling to connect content efforts to key performance indicators such as ROI or customer conversion rates.
Close behind are generating high-quality leads (17%) and difficulty producing engaging content (16%). These challenges suggest that while lead generation remains a cornerstone of content marketing, the increasing demand for high-quality, engaging material is stretching internal resources. Budget constraints (15%) and a lack of in-house expertise (14%) further compound these issues, pointing to structural and operational barriers that may limit the ability of organizations to produce impactful content.
These findings indicate a need for better tools, training, and support. Whether adopting advanced analytics platforms, outsourcing content creation, or investing in team development, marketers must address these challenges to keep pace in a competitive environment.
Effectiveness of Strategies
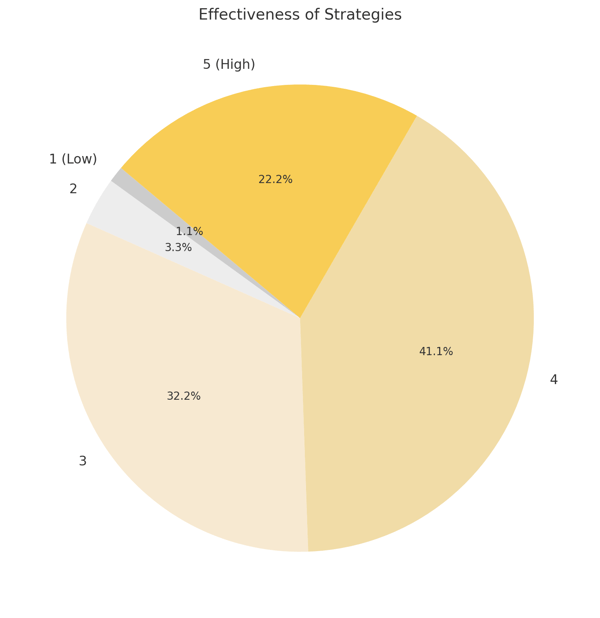
- 1 (Low): 1%
- 2: 3%
- 3: 29%
- 4: 37%
- 5 (High): 20%
The effectiveness of data-driven approaches in guiding content marketing strategies received moderate to high ratings, with 37% scoring a 4 and 20% giving a 5 (high). This indicates general confidence in data’s role in shaping content strategies but also reveals room for improvement. Notably, 29% rated effectiveness as a 3, signaling that while the importance of data is understood, its application may not yet be optimized.
The lower ratings (1% at “low” and 3% at 2) suggest that a minority of respondents struggle with the practical implementation of data-driven strategies. These challenges may stem from a lack of access to quality data, insufficient analytical capabilities, or the inability to translate insights into actionable content strategies.
Overall, the results affirm the critical role of data in content marketing success while highlighting opportunities to refine its application. B2B marketers focusing on improving data integration, analytics training, and decision-making processes will likely see greater returns on their content efforts.
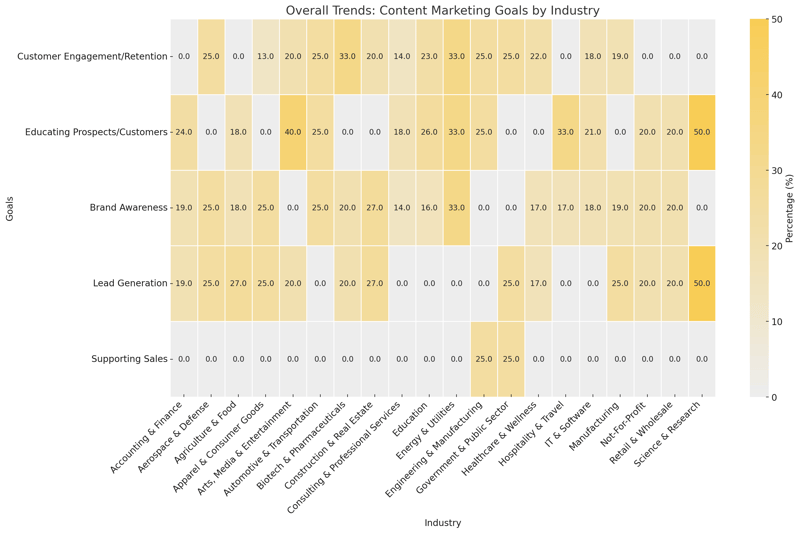
Overall Trends by Industry
- Accounting & Finance:
- Supporting Sales: 24%
- Brand Awareness: 19%
- Lead Generation: 19%
- Aerospace & Defense:
- Brand Awareness: 25%
- Lead Generation: 25%
- Customer Engagement/Retention: 25%
- Agriculture & Food:
- Lead Generation: 27%
- Supporting Sales: 18%
- Brand Awareness: 18%
- Apparel & Consumer Goods:
- Brand Awareness: 25%
- Lead Generation: 25%
- Customer Engagement/Retention: 13%
- Arts, Media & Entertainment:
- Educating Prospects/Customers: 40%
- Lead Generation: 20%
- Customer Engagement/Retention: 20%
- Automotive & Transportation:
- Educating Prospects/Customers: 25%
- Brand Awareness: 25%
- Lead Generation: 25%
- Biotech & Pharmaceuticals:
- Customer Engagement/Retention: 33%
- Brand Awareness: 20%
- Lead Generation: 20%
- Construction & Real Estate:
- Brand Awareness: 27%
- Lead Generation: 27%
- Customer Engagement/Retention: 20%
- Consulting & Professional Services:
- Educating Prospects/Customers: 18%
- Customer Engagement/Retention: 14%
- Brand Awareness: 14%
- Education:
- Educating Prospects/Customers: 26%
- Customer Engagement/Retention: 23%
- Lead Generation: 16%
- Energy & Utilities:
- Brand Awareness: 33%
- Lead Generation: 33%
- Educating Prospects/Customers: 33%
- Engineering & Manufacturing:
- Customer Engagement/Retention: 25%
- Educating Prospects/Customers: 25%
- Supporting Sales: 25%
- Government & Public Sector:
- Lead Generation: 25%
- Customer Engagement/Retention: 25%
- Supporting Sales: 25%
- Healthcare & Wellness:
- Customer Engagement/Retention: 22%
- Lead Generation: 17%
- Brand Awareness: 17%
- Hospitality & Travel:
- Supporting Sales: 33%
- Lead Generation: 17%
- Other (please specify): 17%
- IT & Software:
- Educating Prospects/Customers: 21%
- Lead Generation: 18%
- Brand Awareness: 18%
- Manufacturing:
- Lead Generation: 25%
- Customer Engagement/Retention: 19%
- Brand Awareness: 19%
- Not-For-Profit:
- Brand Awareness: 20%
- Lead Generation: 20%
- Educating Prospects/Customers: 20%
- Retail & Wholesale:
- Brand Awareness: 20%
- Lead Generation: 20%
- Educating Prospects/Customers: 20%
- Science & Research:
- Lead Generation: 50%
- Educating Prospects/Customers: 50%
Overall Trends by Industry
(Challenges - Top 3)
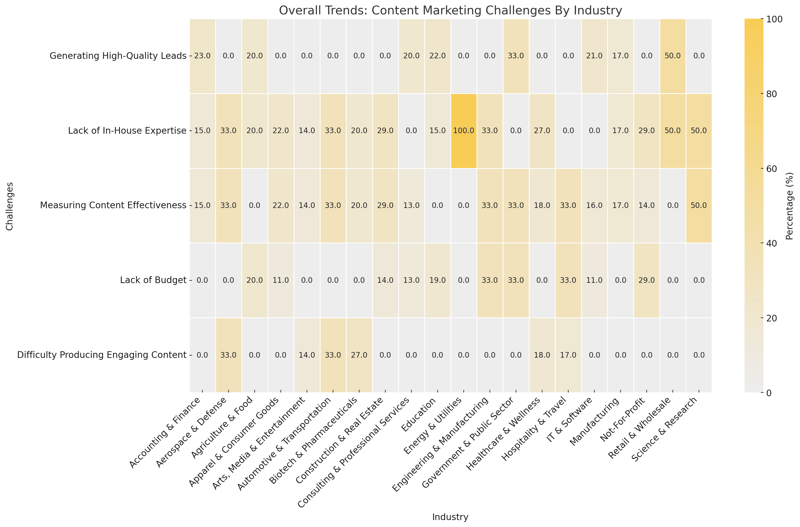
- Accounting & Finance:
- Generating High-Quality Leads: 23%
- Lack of In-House Expertise: 15%
- Lack of Budget: 15%
- Aerospace & Defense:
- Lack of In-House Expertise: 33%
- Difficulty Producing Engaging Content: 33%
- Measuring Content Effectiveness: 33%
- Agriculture & Food:
- Difficulty Producing Engaging Content: 20%
- Generating High-Quality Leads: 20%
- Lack of In-House Expertise: 20%
- Apparel & Consumer Goods:
- Difficulty Producing Engaging Content: 22%
- Measuring Content Effectiveness: 22%
- Lack of Budget: 11%
- Arts, Media & Entertainment:
- Aligning Content with Sales Goals: 14%
- Difficulty Producing Engaging Content: 14%
- Measuring Content Effectiveness: 14%
- Automotive & Transportation:
- Lack of In-House Expertise: 33%
- Lack of Budget: 33%
- Measuring Content Effectiveness: 33%
- Biotech & Pharmaceuticals:
- Difficulty Producing Engaging Content: 27%
- Measuring Content Effectiveness: 20%
- Lack of In-House Expertise: 20%
- Construction & Real Estate:
- Difficulty Producing Engaging Content: 29%
- Measuring Content Effectiveness: 29%
- Lack of Budget: 14%
- Consulting & Professional Services:
- Generating High-Quality Leads: 20%
- Lack of Budget: 13%
- Measuring Content Effectiveness: 13%
- Education:
- Generating High-Quality Leads: 22%
- Lack of Budget: 19%
- Lack of In-House Expertise: 15%
- Energy & Utilities:
- Lack of In-House Expertise: 100%
- Engineering & Manufacturing:
- Measuring Content Effectiveness: 33%
- Difficulty Producing Engaging Content: 33%
- Lack of Budget: 33%
- Government & Public Sector:
- Lack of Budget: 33%
- Generating High-Quality Leads: 33%
- Measuring Content Effectiveness: 33%
- Healthcare & Wellness:
- Lack of In-House Expertise: 27%
- Difficulty Producing Engaging Content: 18%
- Measuring Content Effectiveness: 18%
- Hospitality & Travel:
- Lack of Budget: 33%
- Measuring Content Effectiveness: 33%
- Difficulty Producing Engaging Content: 17%
- IT & Software:
- Generating High-Quality Leads: 21%
- Difficulty Producing Engaging Content: 16%
- Lack of Budget: 11%
- Manufacturing:
- Lack of In-House Expertise: 17%
- Generating High-Quality Leads: 17%
- Measuring Content Effectiveness: 17%
- Not-For-Profit:
- Lack of Budget: 29%
- Lack of In-House Expertise: 29%
- Measuring Content Effectiveness: 14%
- Retail & Wholesale:
- Measuring Content Effectiveness: 50%
- Generating High-Quality Leads: 50%
- Science & Research:
- Lack of In-House Expertise: 50%
- Measuring Content Effectiveness: 50%
Key Takeaways (Percentage-Based)
- Goals: Engagement and education dominate, with over 70% of respondents prioritizing these areas.
- Challenges: Measurement, lead quality, and content engagement are top challenges for at least 50% of respondents.
- Effectiveness: A majority (57%) rate data-driven strategies as highly effective, though there’s room for optimization.
Summary of Findings: Key Insights and Trends
The survey highlights diverse priorities and challenges across industries, each shaped by its unique market conditions and strategic goals. Accounting & Finance focuses on supporting sales (24%) and brand awareness (19%), reflecting a need to align content with revenue generation and differentiation. Meanwhile, IT & Software prioritizes educating prospects/customers (21%) and lead generation (18%), emphasizing thought leadership and customer acquisition. Similarly, Healthcare & Wellness emphasizes customer engagement/retention (22%), reflecting its focus on building long-term, client-centric relationships.
Other industries reveal equally distinct priorities. Manufacturing balances lead generation (25%) with customer engagement (19%), addressing the dual goals of attracting new opportunities and fostering loyalty. Education places a strong emphasis on knowledge-sharing (26%) and engagement (23%), aligning with its mission of informing audiences. In contrast, Energy & Utilities adopts a balanced approach, equally prioritizing brand awareness, lead generation, and education (33% each) to address its multifaceted market needs.
Challenges vary widely across sectors, underscoring unique operational barriers. Accounting & Finance struggles with high-quality lead generation (23%) and in-house expertise (15%), while IT & Software faces hurdles in terms of effectiveness measurement (21%) and content engagement (16%). Manufacturing contends with budget constraints and expertise gaps (17% each), while Retail & Wholesale grapples with measuring effectiveness and lead generation (50% each), reflecting high stakes in performance tracking. These insights emphasize the need for tailored strategies to meet specific goals and overcome the obstacles of each industry, enabling more impactful and relevant content marketing campaigns.
What This Means For You
- Align Content Strategies with Industry-Specific Goals
The survey highlights the importance of tailoring content marketing strategies to the unique priorities of each industry. For example, industries like Accounting & Finance prioritize supporting sales (24%), while IT & Software focus on educating prospects/customers (21%) and lead generation (18%). To stay competitive, your organization should align content efforts with these key objectives, ensuring your campaigns resonate with the specific needs of your target market. - Invest in Tools and Expertise to Overcome Challenges
Common challenges, such as measuring effectiveness (18%), generating high-quality leads (17%), and producing engaging content (16%), highlight operational barriers across industries. Investing in advanced analytics tools, outsourcing to specialized content creators, or upskilling your team can help bridge these gaps, enabling you to produce measurable, impactful content. - Leverage Data to Drive Strategic Decisions
With 57% of respondents rating data-driven strategies as moderately to highly effective, the findings highlight the critical role of data in guiding content marketing success. However, the room for improvement revealed by 29% rating effectiveness as a 3 suggests an opportunity to refine data integration and application. Focus on building robust analytics frameworks to translate insights into actionable strategies and achieve stronger ROI. - Prioritize Customer Engagement and Education
Across industries, customer engagement/retention (25%) and educating prospects/customers (24%) dominate as primary goals, reflecting a shift toward long-term relationship-building. To stay relevant, create value-driven content that informs and creates trust and loyalty, ensuring alignment with your audience’s expectations throughout their journey. - Address Resource Constraints with Scalable Solutions
Challenges like budget constraints (15%) and lack of in-house expertise (14%) are particularly acute for industries like Manufacturing and Not-For-Profit. Organizations facing similar hurdles can benefit from scalable solutions, such as leveraging external agencies or adopting automation tools, to maximize impact without overextending internal resources.
Segmentation Analysis
By Job Function
Content Marketing Goals
The primary goals vary significantly across job functions, reflecting distinct departmental focuses:
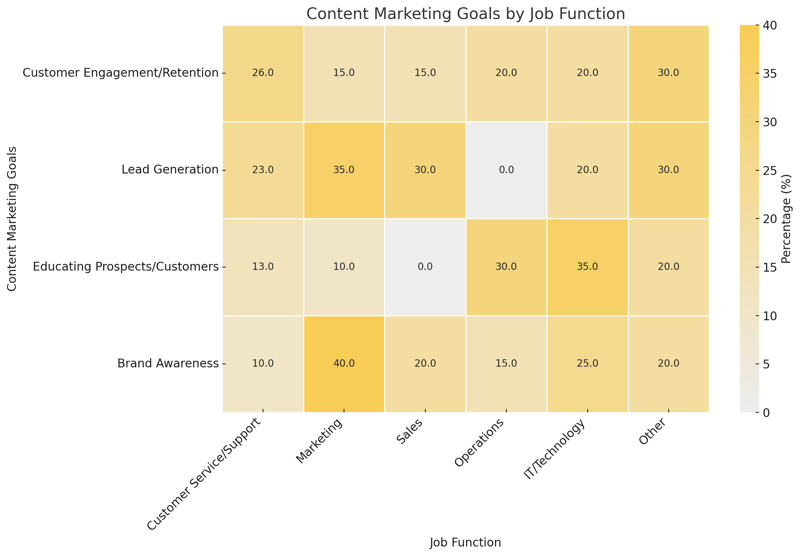
- Customer Service/Support:
- Customer Engagement/Retention: 26%
- Lead Generation: 23%
- Educating Prospects/Customers: 13%
- Brand Awareness: 10%
- Marketing:
- Brand Awareness: 40%
- Lead Generation: 35%
- Customer Engagement/Retention: 15%
- Educating Prospects/Customers: 10%
- Sales:
- Supporting Sales: 35%
- Lead Generation: 30%
- Brand Awareness: 20%
- Customer Engagement/Retention: 15%
- Operations:
- Educating Prospects/Customers: 30%
- Supporting Sales: 25%
- Customer Engagement/Retention: 20%
- Brand Awareness: 15%
- IT/Technology:
- Educating Prospects/Customers: 35%
- Brand Awareness: 25%
- Customer Engagement/Retention: 20%
- Lead Generation: 20%
- Other:
- Customer Engagement/Retention: 30%
- Lead Generation: 30%
- Brand Awareness: 20%
- Educating Prospects/Customers: 20%
Challenges
Each function also faces unique content marketing challenges:
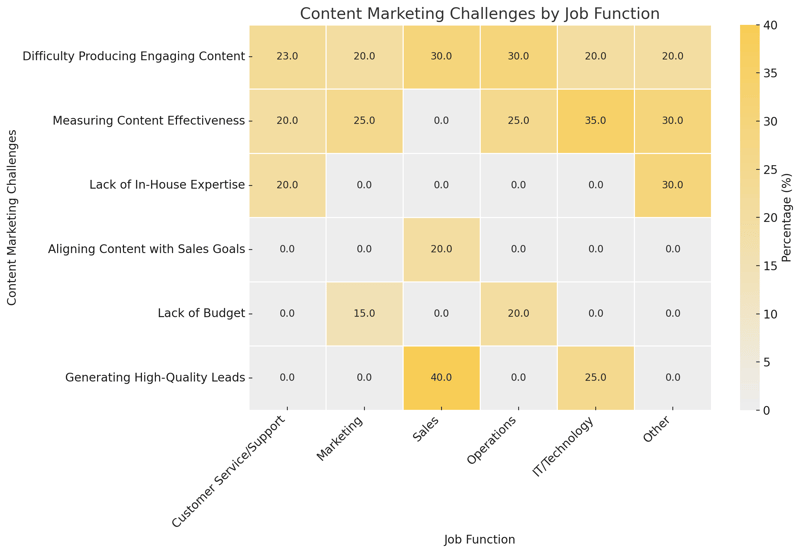
- Customer Service/Support:
- Difficulty Producing Engaging Content: 23%
- Measuring Content Effectiveness: 20%
- Lack of In-House Expertise: 20%
- Marketing:
- Measuring Content Effectiveness: 25%
- Difficulty Producing Engaging Content: 20%
- Lack of Budget: 15%
- Sales:
- Generating High-Quality Leads: 40%
- Difficulty Producing Engaging Content: 30%
- Aligning Content with Sales Goals: 20%
- Operations:
- Difficulty Producing Engaging Content: 30%
- Measuring Content Effectiveness: 25%
- Lack of Budget: 20%
- IT/Technology:
- Measuring Content Effectiveness: 35%
- Generating High-Quality Leads: 25%
- Difficulty Producing Engaging Content: 20%
- Other:
- Lack of In-House Expertise: 30%
- Measuring Content Effectiveness: 30%
- Difficulty Producing Engaging Content: 20%
Key Insights
- Distinct departmental focus: Customer Service prioritizes engagement, while Sales emphasizes lead generation and sales alignment. Marketing shows the broadest focus, balancing brand awareness and customer acquisition.
- Universal challenges: Measuring content effectiveness and producing engaging content are common struggles across functions, reflecting broader industry trends.
- Tailored strategies needed: Each function's goals and challenged require specialized approaches. For instance, Sales may benefit from content explicitly aligned with sales processes, while IT/Technology might need advanced tools to track effectiveness.
Detailed Insights: By Job Function
The survey highlights clear differences in content marketing goals and challenges across job functions, reflecting the unique priorities and responsibilities of each department. Customer Service/Support focuses heavily on customer engagement and retention (26%), aligning with its role in fostering long-term relationships. Similarly, Marketing emphasizes brand awareness (40%) and lead generation (35%), showcasing its central role in driving visibility and acquiring new opportunities. Meanwhile, Sales prioritizes supporting sales (35%) and lead generation (30%), highlighting the department’s alignment with revenue-generating activities. Interestingly, IT/Technology places significant emphasis on educating prospects/customers (35%), which may indicate a push toward thought leadership in a highly technical field.
Despite these diverse goals, common challenges emerge across functions. Difficulty producing engaging content and measuring content effectiveness are recurring pain points, with Marketing (25%) and IT/Technology (35%) particularly citing effectiveness tracking as a top challenge. Sales highlights generating high-quality leads (40%) as its most significant hurdle, reflecting the department’s reliance on marketing to deliver actionable opportunities. These insights reveal the shared struggle of aligning content strategies with measurable outcomes, regardless of functional focus.
Organizations need tailored content strategies to address these challenges and meet departmental goals. For example, Sales can benefit from content explicitly designed for lead conversions, such as case studies or product demos, while Customer Service may require resources to improve post-sale engagement. Additionally, providing tools and training to measure effectiveness and create compelling, data-driven content could alleviate struggles across functions. These nuanced insights highlight the importance of cross-functional collaboration in achieving content marketing success.
By Seniority Level
Perceptions of ROI Measurement Effectiveness
Respondents were asked to rate the effectiveness of a data-driven approach to guiding content marketing success on a scale of 1 (low) to 5 (high). The distribution of responses across seniority levels shows distinct patterns:
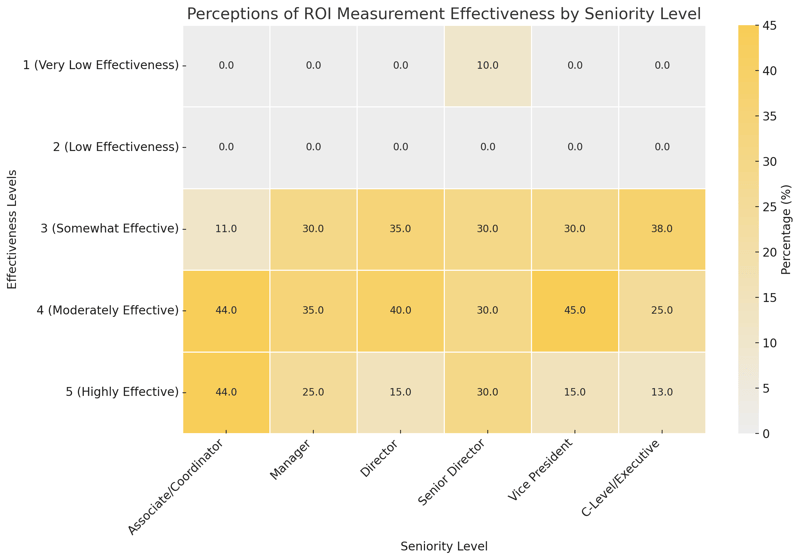
- Associate/Coordinator:
- Highly Effective (5): 44%
- Moderately Effective (4): 44%
- Somewhat Effective (3): 11%
- Manager:
- Moderately Effective (4): 35%
- Somewhat Effective (3): 30%
- Highly Effective (5): 25%
- Director:
- Moderately Effective (4): 40%
- Somewhat Effective (3): 35%
- Highly Effective (5): 15%
- Senior Director:
- Highly Effective (5): 30%
- Moderately Effective (4): 30%
- Somewhat Effective (3): 30%
- Low Effectiveness (2): 10%
- Vice President:
- Moderately Effective (4): 45%
- Somewhat Effective (3): 30%
- Highly Effective (5): 15%
- C-Level/Executive (CEO, CMO, etc.):
- Somewhat Effective (3): 38%
- Moderately Effective (4): 25%
- Highly Effective (5): 13%
Willingness to Invest in Experimental or Innovative Strategies
Respondents rated their willingness to invest in experimental or innovative content marketing strategies on a scale of 1 (low) to 5 (high). Here’s how willingness varied by seniority level:
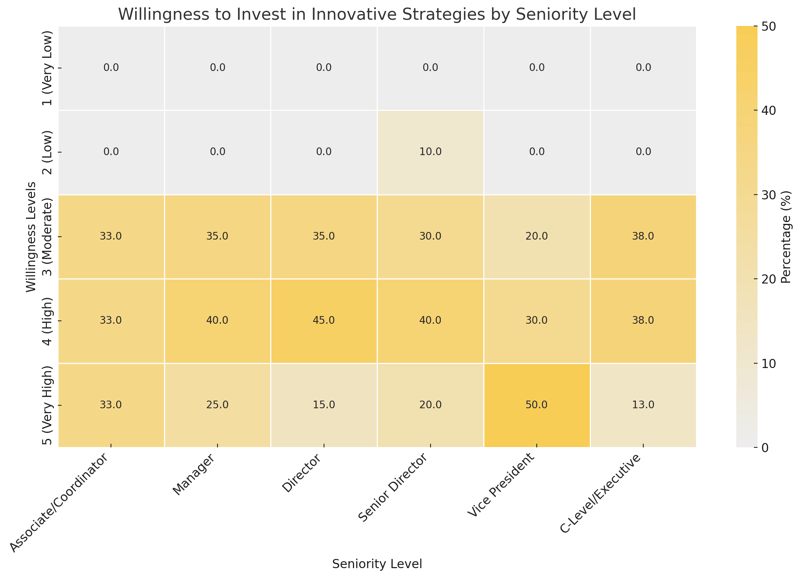
- Associate/Coordinator:
- Moderate (3): 33%
- High (4): 33%
- Very High (5): 33%
- Manager:
- High (4): 40%
- Moderate (3): 35%
- Very High (5): 25%
- Director:
- High (4): 45%
- Moderate (3): 35%
- Very High (5): 15%
- Senior Director:
- High (4): 40%
- Moderate (3): 30%
- Very High (5): 20%
- Low (2): 10%
- Vice President:
- Very High (5): 50%
- High (4): 30%
- Moderate (3): 20%
- C-Level/Executive (CEO, CMO, etc.):
- Moderate (3): 38%
- High (4): 38%
- Very High (5): 13%
Key Insights
- Optimism among Junior levels: Associates/Coordinators tend to rate ROI measurement and willingness to invest in innovation more positively, with 44% finding data-driven approaches "highly effective" and 33% rating their willingness to invest as "very high."
- Caution at the Executive level: C-level executives are more measured in their ratings, with the majority (38%) indicating a moderate willingness to invest and finding data-driven approaches only "somewhat effective."
- Mid-level leadership balances optimism and pragmatism: Managers and Directors generally show balanced confidence in data-driven effectiveness and innovation, reflecting their active role in implementing these strategies.
Detailed Insights: By Seniority Level
The survey reveals distinct differences in perceptions of ROI measurement and willingness to invest in innovative strategies across seniority levels, reflecting varying levels of optimism, risk tolerance, and strategic focus. Associates and Coordinators stand out for their confidence, with 44% rating data-driven approaches as "highly effective" and 33% expressing a "very high" willingness to invest in innovation. This optimism likely stems from their hands-on experience with operational tools and tactics, where measurable results are often more visible.
Confidence remains strong but more tempered at the mid-level leadership tier (Managers and Directors). Managers, for instance, show significant belief in the potential of data-driven approaches, with 35% rating effectiveness as "moderate" and 25% as "high." Similarly, willingness to invest is high, with 40% of Managers and 45% of Directors expressing strong support for innovative strategies. This balance of optimism and caution reflects their dual role in executing strategy while managing risks and reporting to senior leadership.
C-level executives take a more cautious view, with the majority (38%) rating data-driven effectiveness as “somewhat effective” and only 13% indicating a “very high” willingness to invest in innovation. This measured perspective likely stems from their focus on overall organizational ROI and the need to justify significant investments at a macro level. These insights suggest junior and mid-level leaders could benefit from tools and resources to align their enthusiasm with tangible outcomes. At the same time, executives require clear, data-backed evidence to support strategic decision-making and unlock greater innovation. Tailoring communications and resources to these differing perspectives is key to driving organizational alignment and progress.
By Company Size
Budget Allocation
The percentage of marketing budgets allocated to content marketing varies significantly by company size, reflecting differences in resource availability and priorities:
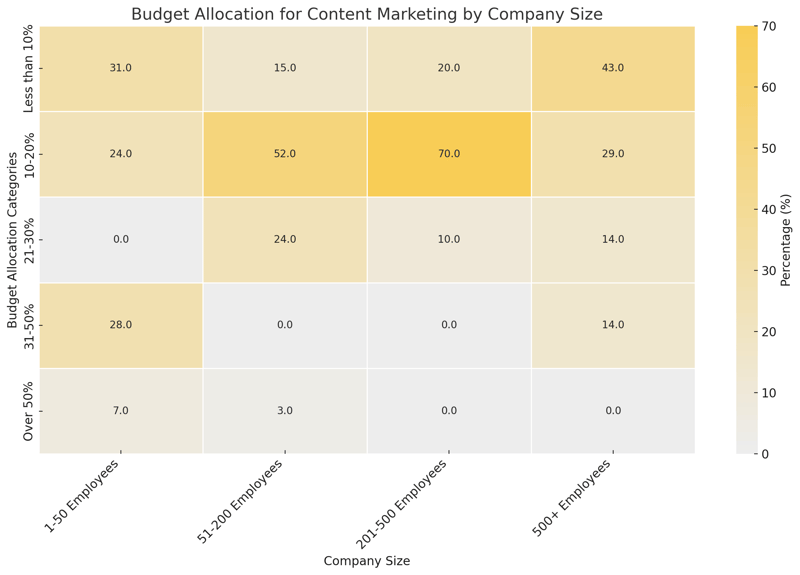
- 1-50 Employees:
- Less than 10%: 31%
- 31-50%: 28%
- 10-20%: 24%
- Over 50%: 7%
- 51-200 Employees:
- 10-20%: 52%
- 21-30%: 24%
- Less than 10%: 15%
- Over 50%: 3%
- 201-500 Employees:
- 10-20%: 70%
- Less than 10%: 20%
- 21-30%: 10%
- 500+ Employees:
- Less than 10%: 43%
- 10-20%: 29%
- 21-30% and 31-50%: 14% each
Use of External Resources
Smaller companies are less likely to use external content creation resources, while mid-sized companies rely on them more heavily:
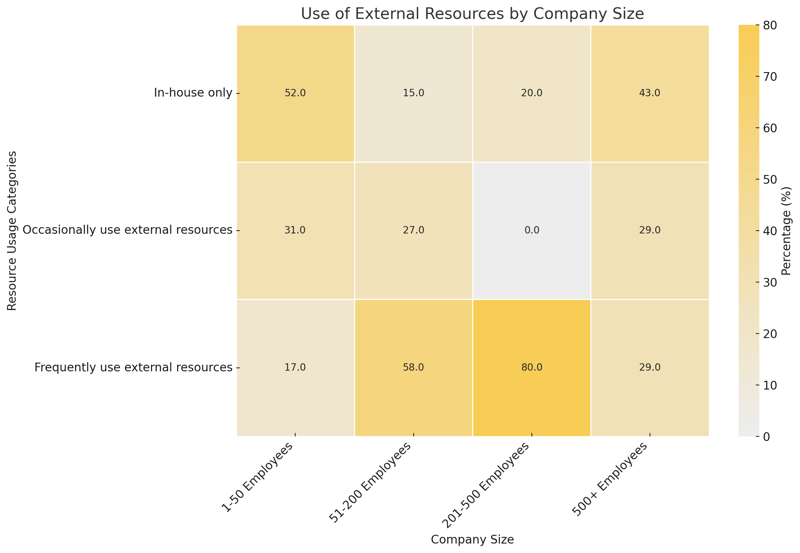
- 1-50 Employees:
- In-house only: 52%
- Occasionally use external resources: 31%
- Frequently use external resources: 17%
- 51-200 Employees:
- Frequently use external resources: 58%
- Occasionally use external resources: 27%
- In-house only: 15%
- 201-500 Employees:
- Frequently use external resources: 80%
- In-house only: 20%
- 500+ Employees:
- In-house only: 43%
- Occasionally and frequently use external resources: 29% each
Challenges
The top challenges faced by companies of different sizes reflect their unique operational hurdles:
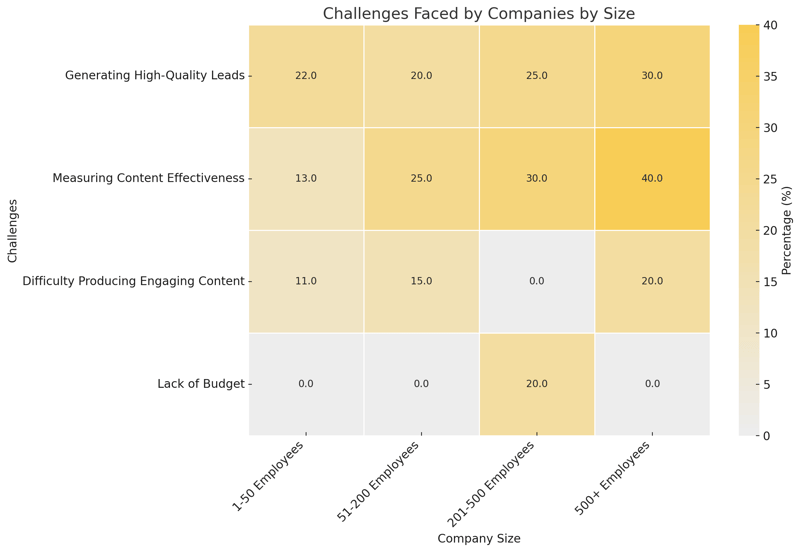
- 1-50 Employees:
- Generating High-Quality Leads: 22%
- Measuring Content Effectiveness: 13%
- Lack of In-House Expertise: 11%
- 51-200 Employees:
- Measuring Content Effectiveness: 25%
- Generating High-Quality Leads: 20%
- Difficulty Producing Engaging Content: 15%
- 201-500 Employees:
- Measuring Content Effectiveness: 30%
- Generating High-Quality Leads: 25%
- Lack of Budget: 20%
- 500+ Employees:
- Measuring Content Effectiveness: 40%
- Generating High-Quality Leads: 30%
- Difficulty Producing Engaging Content: 20%
Key Insights
- Smaller companies face resource constraints: Companies with 1-50 employees tend to allocate smaller percentages of their budget to content marketing and rely primarily on in-house resources. Their top challenges—lead generation and lack of expertise—reflect limited resources and scalability struggles.
- Mid-sized companies embrace outsourcing: 51-200 and 201-500 employee companies increasingly rely on external agencies or freelancers for content creation, with 80% of 201-500 employee companies frequently using external resources. They also face a heavier focus on measuring effectiveness, indicating a need to justify investments.
-
Larger companies focus on metrics: 500+ employee organizations allocate smaller percentages of their budgets to content marketing but emphasize measuring effectiveness (40%) as a top challenge. Their resource advantage allows for experimentation but demands clear ROI tracking.
Detailed Insights: By Company Size
The survey data underscores distinct differences in content marketing priorities, resource allocation, and challenges based on company size. Smaller companies (1-50 employees) allocate a smaller portion of their marketing budgets to content marketing, with 31% dedicating less than 10%. These companies often rely heavily on in-house resources (52%), with fewer leveraging external help. Their top challenges, including generating high-quality leads (22%) and lack of in-house expertise (11%), reflect limited budgets and the struggle to build scalable content capabilities internally.
Mid-sized companies (51-200 and 201-500 employees) show a notable shift, with a higher likelihood of outsourcing content creation—58% of 51-200 employee companies and 80% of 201-500 employee companies frequently use external resources. This indicates that mid-sized organizations prioritize efficiency and expertise by leveraging agency support or freelancers. Their focus on measuring content effectiveness (up to 30%) suggests an increased need to track and validate the impact of growing content investments, likely driven by pressure to demonstrate ROI as budgets grow.
At the other end of the spectrum, larger companies (500+ employees) allocate a modest share of their budgets to content marketing, with 43% dedicating less than 10%. However, their challenges highlight a sophisticated focus on measuring effectiveness (40%) and generating high-quality leads (30%), showcasing their emphasis on aligning content strategies with measurable business outcomes. These organizations often have the resources to experiment with innovative approaches but face challenges in finding data-driven results.
This segmentation reveals clear opportunities for tailored strategies based on company size. Smaller companies need cost-effective solutions, such as scalable tools or external partnerships, to address resource gaps. Mid-sized firms benefit from advanced analytics and support to measure and optimize their growing investments. Larger organizations, on the other hand, require robust ROI-tracking frameworks and more innovative approaches to content marketing that can generate measurable, high-quality outcomes at scale.
By Industry
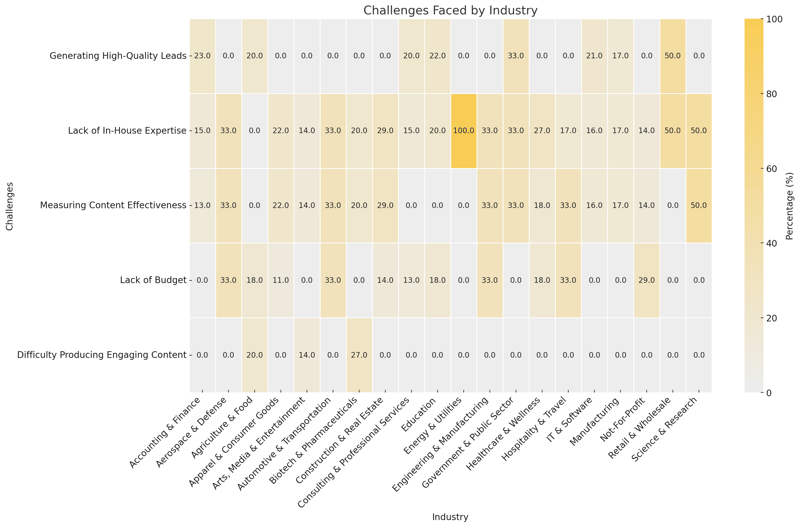
Challenges by Industry
Each industry faces distinct challenges, reflecting its unique operational and market dynamics
- Accounting & Finance:
- Generating High-Quality Leads: 23%
- Lack of In-House Expertise: 15%
- Measuring Content Effectiveness: 13%
- Aerospace & Defense:
- Lack of In-House Expertise: 33%
- Difficulty Producing Engaging Content: 33%
- Measuring Content Effectiveness: 33%
- Agriculture & Food:
- Difficulty Producing Engaging Content: 20%
- Generating High-Quality Leads: 20%
- Lack of Budget: 18%
- Apparel & Consumer Goods:
- Difficulty Producing Engaging Content: 22%
- Measuring Content Effectiveness: 22%
- Lack of Budget: 11%
- Arts, Media & Entertainment:
- Aligning Content with Sales Goals: 14%
- Difficulty Producing Engaging Content: 14%
- Measuring Content Effectiveness: 14%
- Automotive & Transportation:
- Lack of In-House Expertise: 33%
- Difficulty Producing Engaging Content: 33%
- Measuring Content Effectiveness: 33%
- Biotech & Pharmaceuticals:
- Difficulty Producing Engaging Content: 27%
- Measuring Content Effectiveness: 20%
- Lack of In-House Expertise: 20%
- Construction & Real Estate:
- Difficulty Producing Engaging Content: 29%
- Measuring Content Effectiveness: 29%
- Lack of Budget: 14%
- Consulting & Professional Services:
- Generating High-Quality Leads: 20%
- Measuring Content Effectiveness: 15%
- Lack of Budget: 13%
- Education:
- Generating High-Quality Leads: 22%
- Measuring Content Effectiveness: 20%
- Lack of Budget: 18%
- Energy & Utilities:
- Lack of In-House Expertise: 100%
- Engineering & Manufacturing:
- Measuring Content Effectiveness: 33%
- Difficulty Producing Engaging Content: 33%
- Lack of Budget: 33%
- Government & Public Sector:
- Lack of Budget: 33%
- Generating High-Quality Leads: 33%
- Measuring Content Effectiveness: 33%
- Healthcare & Wellness:
- Lack of In-House Expertise: 27%
- Difficulty Producing Engaging Content: 18%
- Measuring Content Effectiveness: 18%
- Hospitality & Travel:
- Lack of Budget: 33%
- Measuring Content Effectiveness: 33%
- Difficulty Producing Engaging Content: 17%
- IT & Software:
- Generating High-Quality Leads: 21%
- Difficulty Producing Engaging Content: 16%
- Measuring Content Effectiveness: 16%
- Manufacturing:
- Lack of In-House Expertise: 17%
- Generating High-Quality Leads: 17%
- Measuring Content Effectiveness: 17%
- Not-For-Profit:
- Lack of Budget: 29%
- Measuring Content Effectiveness: 14%
- Lack of In-House Expertise: 14%
- Retail & Wholesale:
- Measuring Content Effectiveness: 50%
- Generating High-Quality Leads: 50%
- Science & Research:
- Lack of In-House Expertise: 50%
- Measuring Content Effectiveness: 50%
Key Insights
- Common themes across industries: Measuring content effectiveness, generating high-quality leads, and producing engaging content are consistent challenges across most sectors. This reflects universal struggles with tying content to measurable business outcomes and crafting compelling materials.
- Industry-specific challenges: Resource-intensive industries like Aerospace & Defense and Engineering & Manufacturing report high levels of difficulty with in-house expertise and budgets, likely due to the technical complexity of their markets. Similarly, Retail & Wholesale and Science & Research place significant emphasis on effectiveness measurement (50%), showcasing the importance of data-driven strategies.
- Budgetary constraints: Sectors like Not-For-Profit (29%), Education (18%), and Hospitality & Travel (33%) highlight budget issues, suggesting a need for cost-effective content strategies.
Detailed Insights: By Industry
The survey reveals that while certain content marketing challenges are universal, industries face unique obstacles shaped by their market dynamics and operational constraints. Across most sectors, measuring content effectiveness emerges as a dominant challenge, with industries like Retail & Wholesale and Science & Research citing it as a top issue for 50% of respondents. This underscores the widespread difficulty in tying content efforts to measurable outcomes, a critical gap in demonstrating ROI and optimizing strategies. Similarly, generating high-quality leads is another common hurdle, appearing prominently in industries such as Accounting & Finance (23%) and IT & Software (21%), reflecting the high stakes of lead acquisition in competitive markets.
Industry-specific challenges also highlight distinct needs. Resource-intensive sectors like Aerospace & Defense and Engineering & Manufacturing report significant issues with a lack of in-house expertise and budget constraints (33% each). These challenges likely stem from the technical complexity and specialized knowledge required to create compelling content in these fields. On the other hand, industries such as Not-For-Profit (29%) and Hospitality & Travel (33%) emphasize budgetary limitations, showcasing the need for cost-effective content strategies. For sectors like Healthcare & Wellness, where difficulty producing engaging content (18%) is a notable challenge, creating accessible, audience-centric materials is paramount.
These insights highlight the importance of customized solutions that address each industry's distinct challenges and goals. For instance, industries that rely on technical content may prioritize advanced training and tools to upskill their teams, while budget-conscious sectors might focus on scalable, cost-effective content strategies. By addressing these specific needs, organizations can craft more relevant strategies that drive measurable success tailored to their industry.
Summary of Findings: Segmentation Analysis
The segmentation analysis highlights distinct priorities and challenges across job functions, seniority levels, company sizes, and industries. Customer Service emphasizes customer engagement and retention (26%), while Marketing focuses on brand awareness (40%) and lead generation (35%). Despite these differences, shared challenges such as producing engaging content and measuring effectiveness affect multiple functions, with Sales (40% generating high-quality leads) and IT/Technology (35% measuring effectiveness) experiencing notable pain points. These trends underscore the importance of content strategies that address both universal and function-specific needs.
Investment in innovation also varies across seniority levels. Associates/Coordinators exhibit optimism, with 44% rating ROI measurement as highly effective and 33% very willing to invest. In contrast, C-level executives are more cautious, with 38% reporting moderate willingness and lower confidence in ROI measurement, reflecting a need for clearer alignment between operational enthusiasm and strategic decision-making at the leadership level.
Industries and company sizes face unique hurdles. Aerospace & Defense (33%) and Engineering & Manufacturing (33%) struggle with budget constraints and in-house expertise, while Retail & Wholesale (50%) and Science & Research (50%) demand stronger data-driven approaches. Smaller companies rely on in-house resources (52%), whereas mid-sized firms (80%) leverage external support to scale effectively. Larger organizations focus on effectiveness tracking (40%), highlighting their emphasis on measurable outcomes. These findings call for tailored, scalable solutions that address the specific needs of different roles, industries, and organizational sizes to optimize content marketing success.
What This Means For You
- Tailor Content Strategies to Job Functions
Each department has unique goals and challenges, from Customer Service’s focus on engagement (26%) to Marketing’s emphasis on brand awareness (40%) and Sales’ need for lead generation (40%). To succeed, align your content strategies with these specific priorities. For example, create content for Sales that directly supports lead conversions, while Customer Service may benefit from tools and materials that enhance customer retention. - Bridge the Gap Between Data and Decision-Making
The analysis highlights disparities in confidence across seniority levels, with Associates (44% highly effective in ROI measurement) showing more optimism than C-level executives (13% highly effective). Invest in advanced tools and clear communication strategies to align operational enthusiasm with leadership’s need for measurable results. This can empower all levels to make data-informed decisions and embrace innovative approaches. - Scale Resources to Match Company Size and Industry Needs
Smaller companies face resource constraints, relying on in-house content creation (52%), while mid-sized firms (80%) frequently leverage external support. Larger organizations emphasize effectiveness tracking (40%), underscoring the need for measurable outcomes. Assess your company’s resources and scalability to determine whether to invest in training, outsourcing, or analytics platforms that drive efficiency and results. - Address Industry-Specific Challenges with Custom Solutions
Industries like Aerospace & Defense and Engineering & Manufacturing (33% lack in-house expertise) require specialized training and tools to overcome technical content barriers. Meanwhile, Retail & Wholesale and Science & Research (50% effectiveness measurement) demand robust data-driven strategies. Focus on creating tailored solutions—whether by offering scalable content strategies or investing in advanced analytics—that align with your industry’s unique needs. - Prioritize Engagement, Education, and Measurement
Across all segments, engagement (26%) and education (24%) emerge as top goals, emphasizing the need to foster long-term relationships and build audience trust. However, challenges like producing engaging content (16%) and measuring effectiveness (18%) persist. Focus on developing content that resonates with your audience while ensuring you have the tools to track its impact effectively.
Effectiveness and Confidence Scores
Effectiveness of Data-Driven Approaches
Distribution of Ratings
Respondents rated the effectiveness of data-driven approaches in guiding content marketing success on a scale of 1 (low) to 5 (high):
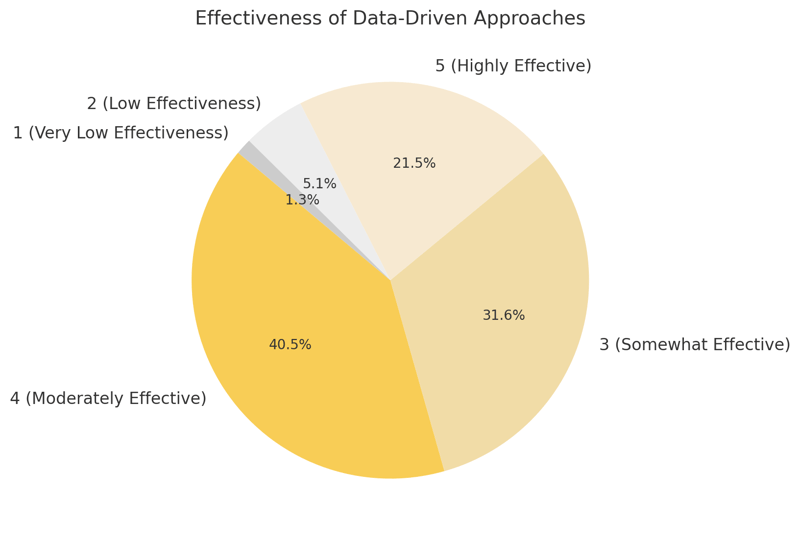
- 4 (Moderately Effective): 40.5%
- 3 (Somewhat Effective): 31.6%
- 5 (Highly Effective): 21.5%
- 2 (Low Effectiveness): 5.1%
- 1 (Very Low Effectiveness): 1.3%
This distribution shows that over 60% of respondents rate data-driven approaches as moderately to highly effective (scores of 4 or 5), indicating a general confidence in their value. However, 31.6% rated them as "somewhat effective," suggesting that while data is useful, many organizations struggle to fully optimize its potential.
Cross-Analysis of High Effectiveness Ratings
Among respondents who rated data-driven approaches as a 4 or 5, the following patterns emerged:
- Top Goals:
- Customer Engagement/Retention: 16.7%
- Educating Prospects/Customers: 15.9%
- Brand Awareness and Lead Generation: Each at 15.2%
This shows that organizations finding data-driven strategies effective often prioritize relationship-building and value-driven goals, such as education and engagement.
- Top Challenges:
- Difficulty Producing Engaging Content: 15.7%
- Measuring Content Effectiveness: 13.9%
- Lack of In-House Expertise: 13.0%
Interestingly, even among organizations rating data strategies highly, challenges such as content engagement and effectiveness measurement persist. This suggests that while data can enhance content marketing, its application might not fully address these pain points.
Insights
Organizations rating data-driven approaches highly often prioritize strategic goals like engagement, education, and awareness. However, these same organizations still struggle with challenges like producing engaging content and measuring effectiveness, reflecting a gap between data insights and actionable execution. To close this gap, businesses need advanced tools or expertise to convert data into compelling, measurable content strategies.
Confidence in ROI Measurement
Distribution of Ratings
Respondents rated their confidence in measuring the ROI of content marketing on a scale of 1 (low) to 5 (high):

- 5 (Very Confident): 26.6%
- 4 (Confident): 25.3%
- 3 (Somewhat Confident): 20.3%
- 2 (Low Confidence): 20.3%
- 1 (Not Confident): 7.6%
This distribution indicates that while over half of respondents expressed moderate to high confidence (scores of 4 or 5), a significant proportion (27.9%) reports low confidence (scores of 1 or 2), reflecting a need for improved ROI measurement capabilities.
Confidence by Company Size
.png?width=800&height=561&name=Confidence%20In%20ROI%20Measurement%20By%20Company%20Size%20(1).png)
- 1-50 Employees:
- Very Confident (5): 13.8%
- Confident (4): 17.2%
- Somewhat Confident (3): 31.0%
- Low Confidence (2): 27.6%
- Not Confident (1): 10.3%
- 51-200 Employees:
- Very Confident (5): 39.4%
- Confident (4): 27.3%
- Somewhat Confident (3): 15.2%
- Low Confidence (2): 15.2%
- Not Confident (1): 3.0%
- 201-500 Employees:
- Very Confident (5): 40.0%
- Confident (4): 30.0%
- Somewhat Confident (3): 10.0%
- Low Confidence (2): 10.0%
- Not Confident (1): 10.0%
- 500+ Employees:
- Very Confident (5): 14.3%
- Confident (4): 42.9%
- Somewhat Confident (3): 14.3%
- Low Confidence (2): 28.6%
- Not Confident (1): 0%
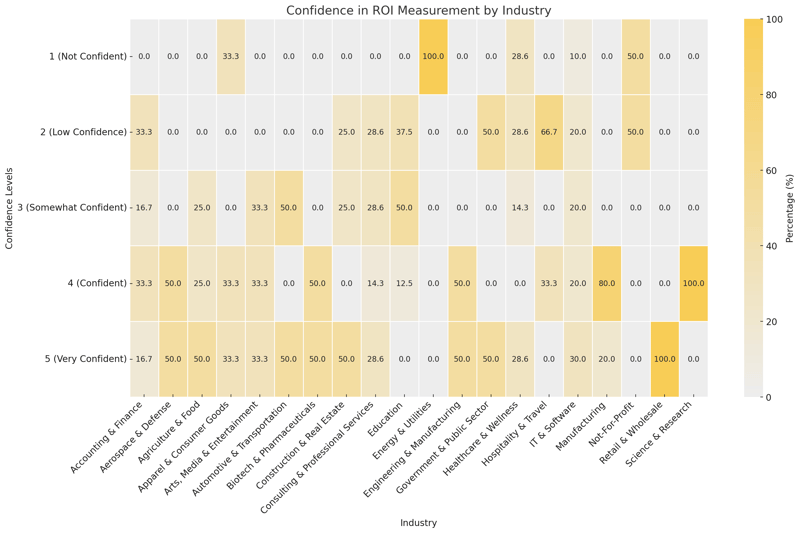
Confidence in ROI Measurement by Industry
Respondents rated their confidence in measuring the ROI of content marketing on a scale of 1 (low) to 5 (high). Here is the breakdown by industry:
-
- Accounting & Finance:
- 5 (Very Confident): 16.7%
- 4 (Confident): 33.3%
- 3 (Somewhat Confident): 16.7%
- 2 (Low Confidence): 33.3%
- Aerospace & Defense:
- 5 (Very Confident): 50.0%
- 4 (Confident): 50.0%
- Agriculture & Food:
- 5 (Very Confident): 50.0%
- 4 (Confident): 25.0%
- 3 (Somewhat Confident): 25.0%
- Apparel & Consumer Goods:
- 5 (Very Confident): 33.3%
- 4 (Confident): 33.3%
- 1 (Not Confident): 33.3%
- Arts, Media & Entertainment:
- 5 (Very Confident): 33.3%
- 4 (Confident): 33.3%
- 3 (Somewhat Confident): 33.3%
- Automotive & Transportation:
- 5 (Very Confident): 50.0%
- 3 (Somewhat Confident): 50.0%
- Biotech & Pharmaceuticals:
- 5 (Very Confident): 50.0%
- 4 (Confident): 50.0%
- Construction & Real Estate:
- 5 (Very Confident): 50.0%
- 3 (Somewhat Confident): 25.0%
- 2 (Low Confidence): 25.0%
- Consulting & Professional Services:
- 5 (Very Confident): 28.6%
- 4 (Confident): 14.3%
- 3 (Somewhat Confident): 28.6%
- 2 (Low Confidence): 28.6%
- Education:
- 4 (Confident): 12.5%
- 3 (Somewhat Confident): 50.0%
- 2 (Low Confidence): 37.5%
- Energy & Utilities:
- 1 (Not Confident): 100.0%
- Engineering & Manufacturing:
- 5 (Very Confident): 50.0%
- 4 (Confident): 50.0%
- Government & Public Sector:
- 5 (Very Confident): 50.0%
- 2 (Low Confidence): 50.0%
- Healthcare & Wellness:
- 5 (Very Confident): 28.6%
- 3 (Somewhat Confident): 14.3%
- 2 (Low Confidence): 28.6%
- 1 (Not Confident): 28.6%
- Hospitality & Travel:
- 4 (Confident): 33.3%
- 2 (Low Confidence): 66.7%
- IT & Software:
- 5 (Very Confident): 30.0%
- 4 (Confident): 20.0%
- 3 (Somewhat Confident): 20.0%
- 2 (Low Confidence): 20.0%
- 1 (Not Confident): 10.0%
- Manufacturing:
- 5 (Very Confident): 20.0%
- 4 (Confident): 80.0%
- Not-For-Profit:
- 2 (Low Confidence): 50.0%
- 1 (Not Confident): 50.0%
- Retail & Wholesale:
- 5 (Very Confident): 100.0%
- Science & Research:
- 4 (Confident): 100.0%
- 4 (Confident): 100.0%
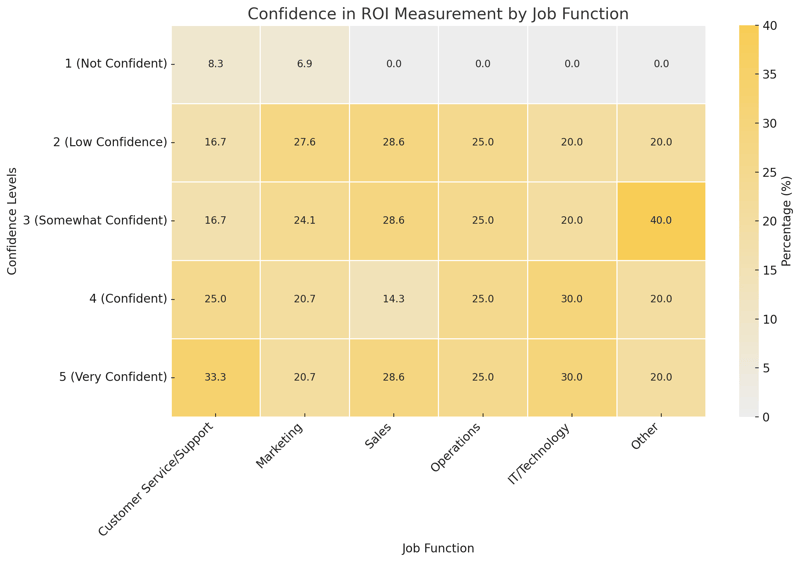
Confidence in ROI Measurement by Job Function
Respondents rated their confidence in measuring the ROI of content marketing on a scale of 1 (low) to 5 (high). Here is the breakdown by job function:
- Accounting & Finance:
- Customer Service/Support:
- 5 (Very Confident): 33.3%
- 4 (Confident): 25.0%
- 3 (Somewhat Confident): 16.7%
- 2 (Low Confidence): 16.7%
- 1 (Not Confident): 8.3%
- Marketing:
- 5 (Very Confident): 20.7%
- 4 (Confident): 20.7%
- 3 (Somewhat Confident): 24.1%
- 2 (Low Confidence): 27.6%
- 1 (Not Confident): 6.9%
- Sales:
- 5 (Very Confident): 28.6%
- 4 (Confident): 14.3%
- 3 (Somewhat Confident): 28.6%
- 2 (Low Confidence): 28.6%
- Operations:
- 5 (Very Confident): 25.0%
- 4 (Confident): 25.0%
- 3 (Somewhat Confident): 25.0%
- 2 (Low Confidence): 25.0%
- IT/Technology:
- 5 (Very Confident): 30.0%
- 4 (Confident): 30.0%
- 3 (Somewhat Confident): 20.0%
- 2 (Low Confidence): 20.0%
- Other:
- 5 (Very Confident): 20.0%
- 4 (Confident): 20.0%
- 3 (Somewhat Confident): 40.0%
- 2 (Low Confidence): 20.0%
Key Insights
- Confidence varies significantly across industries and roles: Industries like Retail & Wholesale and Biotech & Pharmaceuticals demonstrate the highest confidence levels, with up to 100% of respondents rating their confidence as "very high." Conversely, sectors such as Energy & Utilities and Not-For-Profit report universally low confidence. Among roles, Customer Service/Support shows the strongest confidence, with 33.3% rating themselves as "very confident," while Marketing and Sales exhibit wide variability, indicating potential gaps in measurement tools or alignment.
- Smaller companies struggle more with ROI measurement: Smaller companies (1-50 employees) report the lowest confidence levels, with 27.6% rating confidence as "low" and 10.3% as "not confident." In contrast, mid-sized organizations (51-500 employees) show greater confidence, likely due to better access to tools and resources. Larger companies (500+ employees) are more balanced, with confidence concentrated in "confident" (43%) but also showing some signs of struggle, with 28.6% at "low confidence."
- Room for improvement across all groups: Despite some high-confidence pockets, over 20% of respondents overall report “low confidence” or “not confident” in measuring ROI. This highlights a broader industry challenge in establishing robust frameworks for tracking content marketing performance. The gaps are particularly notable in resource-constrained roles like Marketing and industries like Education, where nearly 37.5% rate confidence as low.
Detailed Insights: Confidence in ROI Measurement
The survey reveals significant variation in confidence levels for measuring the ROI of content marketing, driven by factors such as industry, job function, and company size. While 26.6% of respondents rated their confidence as "very high" and 25.3% as "confident," a substantial portion (27.9%) expressed "low" or "no confidence," reflecting a widespread challenge in tying content efforts to measurable outcomes. Industries like Retail & Wholesale and Biotech & Pharmaceuticals demonstrated strong confidence, with up to 100% of respondents rating their ability as "very high." In contrast, sectors like Energy & Utilities and Not-For-Profit reported universally low confidence, indicating potential gaps in tools, training, or alignment with measurable goals.
Confidence levels also vary by company size. Smaller companies (1-50 employees) face significant struggles, with 27.6% reporting low confidence and 10.3% not confident at all. These organizations likely lack access to the advanced tools and resources that mid-sized companies (51-500 employees) leverage, where confidence levels rise significantly, with 40% or more rating themselves as "very confident." Larger companies (500+ employees) report mixed results, with 42.9% confident but also 28.6% expressing low confidence, reflecting the complexity of aligning measurement across large-scale operations.
Job function further highlights the challenges in ROI measurement. Customer Service/Support leads in confidence, with 33.3% rating themselves as "very confident," likely reflecting their proximity to customer engagement metrics. However, variability is most pronounced in Marketing and Sales, where confidence ranges from low (27.6%) to very high (20.7%), indicating a need for clearer alignment between content efforts and measurable sales outcomes. These findings highlight a critical need for tailored measurement tools, cross-functional training, and industry-specific solutions to bridge the confidence gap and enable more actionable ROI tracking across the board.
Summary of Findings: Effectiveness and Content Scores
The survey reveals various perceptions surrounding the effectiveness of data-driven content marketing and ROI measurement. While over 60% of respondents rate data-driven strategies as moderately to highly effective, challenges like producing engaging content (15.7%) and measuring effectiveness (13.9%) persist. These findings highlight a disconnect between the availability of data and its practical application in achieving measurable outcomes.
Confidence in ROI measurement varies significantly across company sizes and industries. Smaller companies (1-50 employees) face notable struggles, with 27.6% reporting low confidence, while mid-sized firms (51-500 employees) demonstrate greater optimism, likely due to access to more robust tools and resources. Larger organizations (500+ employees) present mixed results, balancing high confidence (42.9%) with persistent doubts among 28.6% of respondents.
Industries and roles further illustrate these disparities. Sectors like Retail & Wholesale and Biotech & Pharmaceuticals lead in confidence, with 100% of respondents rating themselves as “very confident.” In contrast, the Energy & Utilities and Not-For-Profit sectors report universally low confidence. Similarly, Customer Service/Support (33.3% very confident) demonstrates higher confidence tied to engagement metrics, whereas Marketing (27.6% low confidence) and Sales (28.6% low confidence) highlight ongoing gaps in aligning strategies with measurable business results. These findings call for tailored tools, strategic training, and cross-functional collaboration to enhance confidence and drive actionable insights.
What This Means For You
The findings reveal actionable insights for organizations across industries, company sizes, and roles, highlighting key opportunities to optimize content marketing strategies:
- Leverage Data-Driven Strategies More Effectively
With over 60% of respondents rating data-driven approaches as moderately to highly effective, organizations recognize the value of data in guiding content strategies. However, the 31.6% reporting "somewhat effective" underscores the need to refine how insights are applied. Consider investing in tools that bridge the gap between analytics and execution to create content that drives measurable outcomes. - Address Confidence Gaps in ROI Measurement
While 51.9% of respondents expressed moderate to high confidence, a significant 27.9% lack confidence in ROI tracking. Smaller companies (1-50 employees) struggle the most, with 27.6% reporting low confidence. Focus on scalable, affordable tools and training to improve measurement capabilities and align resources with outcomes. - Tailor Strategies to Industry-Specific Needs
Confidence levels vary widely across industries. Sectors like Retail & Wholesale and Biotech & Pharmaceuticals lead with 100% very confident, while Not-For-Profit and Energy & Utilities face universal challenges. Understanding these disparities allows you to adopt solutions aligned with your industry’s unique constraints, such as resource-efficient tools or advanced training programs. - Strengthen Cross-Functional Collaboration
Confidence in ROI measurement diverges sharply across roles, from Customer Service/Support (33.3% very confident) to Marketing (27.6% low confidence) and Sales (28.6% low confidence). Cross-functional alignment—such as integrating marketing and sales analytics—can bridge these gaps and ensure cohesive strategy execution.
Emerging Technologies
Adoption Trends for Emerging Technologies
Respondents expressed interest in exploring the following emerging content technologies and approaches over the next year:
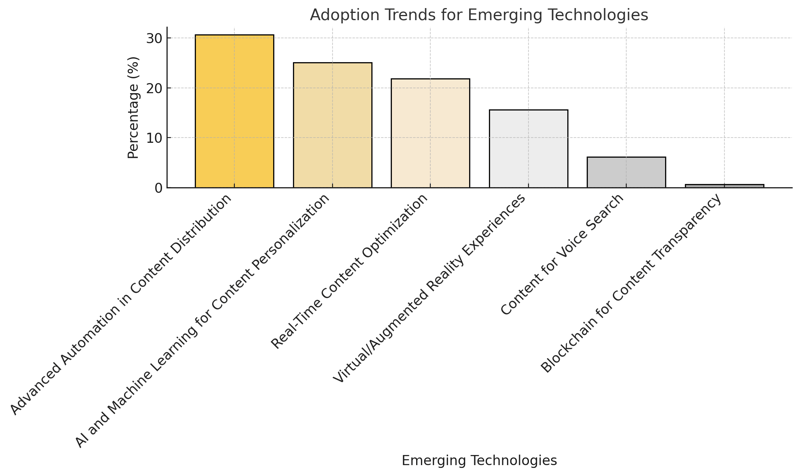
- Advanced Automation in Content Distribution: 30.7%
- AI and Machine Learning for Content Personalization: 25.1%
- Real-Time Content Optimization: 21.8%
- Virtual/Augmented Reality Experiences: 15.6%
- Content for Voice Search: 6.1%
- Blockchain for Content Transparency: 0.6%
Key Insights
- Automation and AI dominate interest: Over half of respondents prioritize automation (30.7%) and AI-driven personalization (25.1%), indicating a strong focus on efficiency and tailored user experiences.
- Growing interest in real-time adaptation: Real-time content optimization (21.8%) ranks third, suggesting an increasing desire to adjust strategies dynamically based on performance data.
- Lower interest in emerging formats: Technologies like virtual/augmented reality (15.6%) and content for voice search (6.1%) show moderate to limited appeal, reflecting either niche applications or uncertainties around ROI.
- Blockchain lags: Blockchain for content transparency (0.6%) sees minimal interest, highlighting the limited adoption of this technology in content marketing strategies.
Detailed Insights: Adoption Trends
The survey highlights clear priorities and emerging trends in content marketing, with automation and AI-driven personalization leading the way. Over half of respondents prioritize these technologies, with automation (30.7%) and AI personalization (25.1%) reflecting a strong focus on efficiency and delivering tailored experiences to their audiences. These tools reshape how marketers approach strategy, enabling streamlined operations and more impactful content delivery.
Real-time content optimization (21.8%) ranks as a growing area of interest, signaling the importance of adapting strategies dynamically based on performance metrics. This trend points to a shift toward more agile content strategies, where real-time data drives decision-making and enhances campaign outcomes.
On the other hand, emerging formats like virtual and augmented reality (15.6%) and voice search content (6.1%) draw less interest. While these technologies hold potential, their moderate appeal suggests that marketers remain cautious, either due to the niche applications or uncertainties surrounding measurable returns on investment.
Blockchain technology for content transparency (0.6%) lags far behind, with minimal adoption among respondents. This limited interest highlights skepticism about its immediate relevance or value in content marketing, with most organizations focusing on tools that deliver more tangible results in the short term.
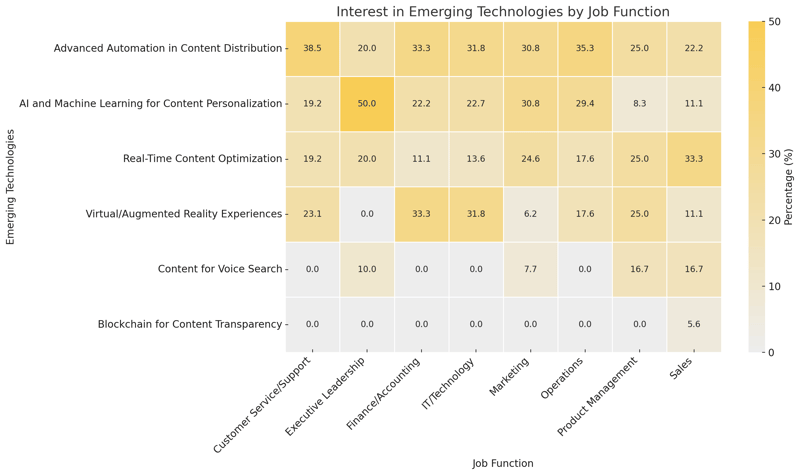
Interest in Emerging Technologies by Job Function
Here’s how interest in emerging technologies and approaches varies across job functions:
- Customer Service/Support:
- Advanced Automation in Content Distribution: 38.5%
- Virtual/Augmented Reality Experiences: 23.1%
- AI and Machine Learning for Content Personalization: 19.2%
- Real-Time Content Optimization: 19.2%
- Executive Leadership:
- AI and Machine Learning for Content Personalization: 50.0%
- Advanced Automation in Content Distribution: 20.0%
- Real-Time Content Optimization: 20.0%
- Content for Voice Search: 10.0%
- Finance/Accounting:
- Virtual/Augmented Reality Experiences: 33.3%
- Advanced Automation in Content Distribution: 33.3%
- AI and Machine Learning for Content Personalization: 22.2%
- Real-Time Content Optimization: 11.1%
- IT/Technology:
- Advanced Automation in Content Distribution: 31.8%
- Virtual/Augmented Reality Experiences: 31.8%
- AI and Machine Learning for Content Personalization: 22.7%
- Real-Time Content Optimization: 13.6%
- Marketing:
- Advanced Automation in Content Distribution: 30.8%
- AI and Machine Learning for Content Personalization: 30.8%
- Real-Time Content Optimization: 24.6%
- Content for Voice Search: 7.7%
- Virtual/Augmented Reality Experiences: 6.2%
- Operations:
- Advanced Automation in Content Distribution: 35.3%
- AI and Machine Learning for Content Personalization: 29.4%
- Virtual/Augmented Reality Experiences: 17.6%
- Real-Time Content Optimization: 17.6%
- Product Management:
- Virtual/Augmented Reality Experiences: 25.0%
- Advanced Automation in Content Distribution: 25.0%
- Real-Time Content Optimization: 25.0%
- Content for Voice Search: 16.7%
- AI and Machine Learning for Content Personalization: 8.3%
- Sales:
- Real-Time Content Optimization: 33.3%
- Advanced Automation in Content Distribution: 22.2%
- Content for Voice Search: 16.7%
- AI and Machine Learning for Content Personalization: 11.1%
- Virtual/Augmented Reality Experiences: 11.1%
- Blockchain for Content Transparency: 5.6%
Key Insights
- Customer service and IT/Technology favour VR: Virtual/Augmented Reality (23.1% and 31.8%, respectively) ranks relatively high for these functions, possibly reflecting their interest in immersive customer and technical experiences.
- Marketing's balanced focus: Marketing professionals show a balanced interest in automation (30.8%), AI (30.8%), and real-time optimization (24.6%), emphasizing efficiency and personalization.
- Sales prioritize real-time optimization: Sales professionals rank real-time content optimization as the highest (33.3%), likely valuing technologies that drive immediate impact on lead generation and conversion.
Detailed Insights: By Job Function
The data reveals varied priorities across professional functions, showcasing how technology preferences align with specific roles and their unique objectives. Virtual and augmented reality stand out for customer service (23.1%) and IT/Technology (31.8%), reflecting an interest in creating immersive experiences that enhance customer interactions and technical workflows. These functions appear to see VR as a valuable tool for innovation in engagement and operational efficiency.
Marketing professionals demonstrate a well-rounded focus, with equal interest in automation (30.8%) and AI-driven personalization (30.8%), alongside real-time optimization (24.6%). This balanced approach highlights their pursuit of both efficiency and tailored user experiences, indicating a commitment to leveraging multiple tools for maximum impact.
For sales teams, real-time content optimization emerges as the top priority (33.3%). This strong preference underscores the importance of immediate, data-driven adjustments to strategies that directly influence lead generation and conversion outcomes. Sales professionals clearly value technologies that deliver results in the moment, aligning closely with their performance-driven goals.
Interest in Emerging Technologies by Seniority Level
Here’s how interest in emerging technologies and approaches varies across seniority levels:
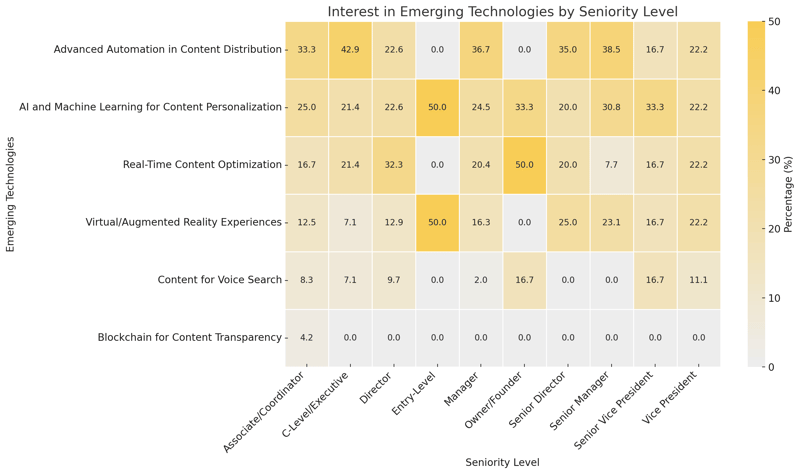
- Associate/Coordinator:
- Advanced Automation in Content Distribution: 33.3%
- AI and Machine Learning for Content Personalization: 25.0%
- Real-Time Content Optimization: 16.7%
- Virtual/Augmented Reality Experiences: 12.5%
- Content for Voice Search: 8.3%
- Blockchain for Content Transparency: 4.2%
- C-Level/Executive (CEO, CMO, etc.):
- Advanced Automation in Content Distribution: 42.9%
- Real-Time Content Optimization: 21.4%
- AI and Machine Learning for Content Personalization: 21.4%
- Content for Voice Search: 7.1%
- Virtual/Augmented Reality Experiences: 7.1%
- Director:
- Real-Time Content Optimization: 32.3%
- AI and Machine Learning for Content Personalization: 22.6%
- Advanced Automation in Content Distribution: 22.6%
- Virtual/Augmented Reality Experiences: 12.9%
- Content for Voice Search: 9.7%
- Entry-Level:
- AI and Machine Learning for Content Personalization: 50.0%
- Virtual/Augmented Reality Experiences: 50.0%
- Manager:
- Advanced Automation in Content Distribution: 36.7%
- AI and Machine Learning for Content Personalization: 24.5%
- Real-Time Content Optimization: 20.4%
- Virtual/Augmented Reality Experiences: 16.3%
- Content for Voice Search: 2.0%
- Owner/Founder:
- Real-Time Content Optimization: 50.0%
- AI and Machine Learning for Content Personalization: 33.3%
- Content for Voice Search: 16.7%
- Senior Director:
- Advanced Automation in Content Distribution: 35.0%
- Virtual/Augmented Reality Experiences: 25.0%
- AI and Machine Learning for Content Personalization: 20.0%
- Real-Time Content Optimization: 20.0%
- Senior Manager:
- Advanced Automation in Content Distribution: 38.5%
- AI and Machine Learning for Content Personalization: 30.8%
- Virtual/Augmented Reality Experiences: 23.1%
- Real-Time Content Optimization: 7.7%
- Senior Vice President:
- AI and Machine Learning for Content Personalization: 33.3%
- Virtual/Augmented Reality Experiences: 16.7%
- Advanced Automation in Content Distribution: 16.7%
- Real-Time Content Optimization: 16.7%
- Content for Voice Search: 16.7%
- Vice President:
- Virtual/Augmented Reality Experiences: 22.2%
- Advanced Automation in Content Distribution: 22.2%
- Real-Time Content Optimization: 22.2%
- AI and Machine Learning for Content Personalization: 22.2%
- Content for Voice Search: 11.1%
Key Insights
- C-level executives prioritize automation: 42.9% of executives focus on advanced automation, reflecting their need for scalable solutions with high impact.
- Junior levels highlight AI: Entry-level employees show strong interest in AI (50%) and virtual/augmented reality (50%), potentially reflecting excitement about innovation and newer technologies.
- Balanced interest across senior roles: Vice Presidents and Senior Directors exhibit balanced interest across technologies, with each technology garnering approximately equal attention.
Detailed Insights: By Seniority Level
The survey reveals distinct priorities across organizational levels, with automation and AI emerging as key areas of focus. C-level executives place a strong emphasis on advanced automation (42.9%), driven by their need for scalable, impactful solutions that align with high-level strategic goals. This focus underscores their priority on technologies that streamline operations while delivering measurable results.
Entry-level employees, on the other hand, show significant enthusiasm for AI (50%) and virtual/augmented reality (50%). This interest likely reflects excitement about cutting-edge technologies and their potential to reshape the way organizations engage with audiences and innovate in content delivery.
Senior roles like Vice Presidents and Senior Directors display a balanced approach to emerging technologies. Their interest is evenly distributed across automation, AI, real-time optimization, and other tools. This even distribution suggests a strategic mindset that values diverse solutions to address multiple aspects of content marketing and operational needs.
Interest in Emerging Technologies by Industry
Here’s how interest in emerging technologies and approaches varies across industries:
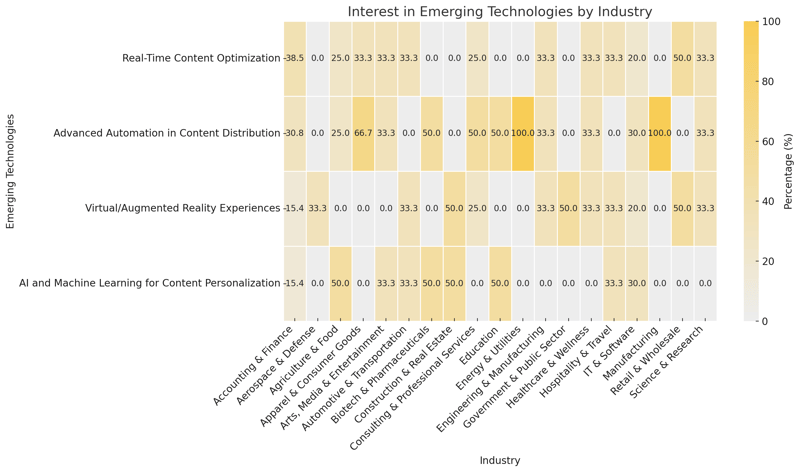
- Accounting & Finance:
- Real-Time Content Optimization: 38.5%
- Advanced Automation in Content Distribution: 30.8%
- Virtual/Augmented Reality Experiences: 15.4%
- AI and Machine Learning for Content Personalization: 15.4%
- Aerospace & Defense:
- Virtual/Augmented Reality Experiences: 33.3%
- Agriculture & Food:
- AI and Machine Learning for Content Personalization: 50.0%
- Advanced Automation in Content Distribution: 25.0%
- Real-Time Content Optimization: 25.0%
- Apparel & Consumer Goods:
- Advanced Automation in Content Distribution: 66.7%
- Real-Time Content Optimization: 33.3%
- Arts, Media & Entertainment:
- AI and Machine Learning for Content Personalization: 33.3%
- Advanced Automation in Content Distribution: 33.3%
- Real-Time Content Optimization: 33.3%
- Automotive & Transportation:
- AI and Machine Learning for Content Personalization: 33.3%
- Virtual/Augmented Reality Experiences: 33.3%
- Real-Time Content Optimization: 33.3%
- Biotech & Pharmaceuticals:
- AI and Machine Learning for Content Personalization: 50.0%
- Advanced Automation in Content Distribution: 50.0%
- Construction & Real Estate:
- Virtual/Augmented Reality Experiences: 50.0%
- AI and Machine Learning for Content Personalization: 50.0%
- Consulting & Professional Services:
- Advanced Automation in Content Distribution: 50.0%
- Virtual/Augmented Reality Experiences: 25.0%
- Real-Time Content Optimization: 25.0%
- Education:
- AI and Machine Learning for Content Personalization: 50.0%
- Advanced Automation in Content Distribution: 50.0%
- Energy & Utilities:
- Advanced Automation in Content Distribution: 100.0%
- Engineering & Manufacturing:
- AI and Machine Learning for Content Personalization: 33.3%
- Advanced Automation in Content Distribution: 33.3%
- Virtual/Augmented Reality Experiences: 33.3%
- Government & Public Sector:
- Virtual/Augmented Reality Experiences: 50.0%
- Healthcare & Wellness:
- Advanced Automation in Content Distribution: 33.3%
- AI and Machine Learning for Content Personalization: 33.3%
- Real-Time Content Optimization: 33.3%
- Hospitality & Travel:
- AI and Machine Learning for Content Personalization: 33.3%
- Virtual/Augmented Reality Experiences: 33.3%
- Real-Time Content Optimization: 33.3%
- IT & Software:
- Advanced Automation in Content Distribution: 30.0%
- AI and Machine Learning for Content Personalization: 30.0%
- Real-Time Content Optimization: 20.0%
- Virtual/Augmented Reality Experiences: 20.0%
- Manufacturing:
- Advanced Automation in Content Distribution: 100.0%
- Retail & Wholesale:
- Content for Voice Search: 50.0%
- Real-Time Content Optimization: 50.0%
- Science & Research:
- AI and Machine Learning for Content Personalization: 33.3%
- Advanced Automation in Content Distribution: 33.3%
- Virtual/Augmented Reality Experiences: 33.3%
Key Insights
- Automation leads across industries: Advanced automation consistently ranks highly, leading in industries like Energy & Utilities (100%) and Manufacturing (100%).
- AI adoption varies: AI is particularly prioritized in Biotech & Pharmaceuticals (50%) and Education (50%), reflecting its role in personalization and knowledge delivery.
- VR adoption in specific sectors: Virtual/Augmented Reality stands out in Construction & Real Estate (50%) and Government & Public Sector (50%), indicating niche use cases.
- Diverse preferences in IT & Software: Interest is balanced across automation (30%), AI (30%), and real-time optimization (20%), showcasing a varied strategic focus.
Detailed Insights: By Industry
The data highlights how technology adoption varies across industries, with automation emerging as a dominant priority. Industries like Energy & Utilities and Manufacturing both report 100% interest in advanced automation, emphasizing the critical role of streamlined processes and efficiency in these sectors. This universal focus showcases automation's ability to address operational challenges at scale.
AI adoption, while prominent in certain areas, shows varied emphasis. Biotech & Pharmaceuticals (50%) and Education (50%) prioritize AI for its capabilities in delivering personalized experiences and enhancing knowledge-sharing. These industries leverage AI to innovate in ways that align closely with their unique operational and engagement needs.
Virtual and augmented reality find their niche in sectors like Construction & Real Estate (50%) and Government & Public Sector (50%). These industries appear to value VR for its specialized applications, such as immersive project visualization or enhanced training programs, where traditional methods fall short.
IT & Software stands out with a balanced approach to emerging technologies, with interest distributed across automation (30%), AI (30%), and real-time optimization (20%). This even spread reflects the industry’s strategic focus on leveraging diverse tools to address a wide range of challenges and opportunities.
Willingness to Invest in Innovative Strategies
Respondents rated their willingness to invest in experimental or innovative content strategies to stay ahead in their industries on a scale of 1 (low) to 5 (high). Here’s the overall distribution:
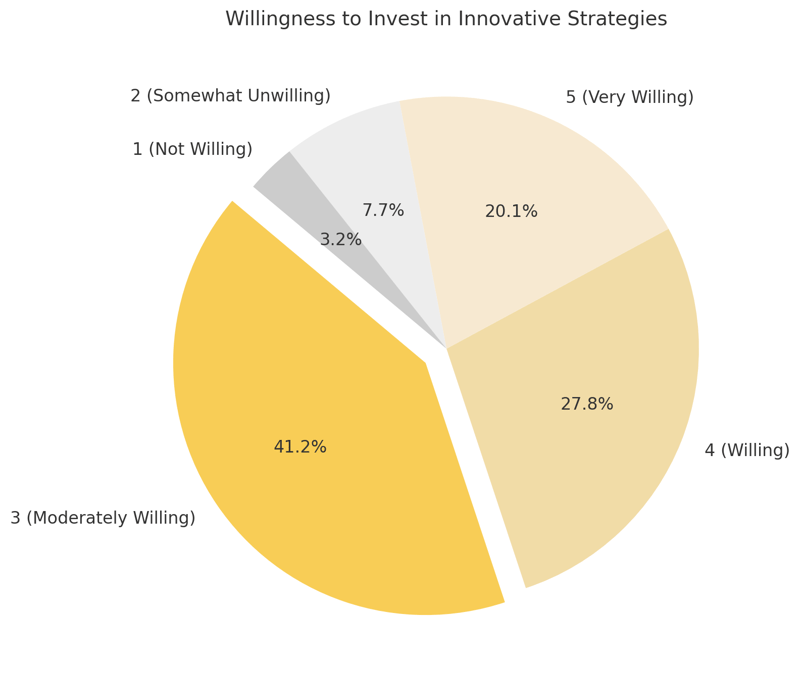
- 3 (Moderately Willing): 41.2%
- 4 (Willing): 27.8%
- 5 (Very Willing): 20.1%
- 2 (Somewhat Unwilling): 7.7%
- 1 (Not Willing): 3.2%
Key Insights
- The majority show moderate to high willingness: Over 89% of respondents report at least moderate willingness (scores of 3, 4, or 5) to invest in innovative strategies, indicating a general openness to experimentation in content marketing.
- Strong enthusiasm in specific groups: Roles like IT/Technology and Product Management demonstrate particularly high willingness, with 50%-75% rating "very willing" (score of 5). This reflects a strong alignment with technological innovation in these areas.
- Mid-sized companies lead in high willingness: Companies with 51-200 employees exhibit the strongest investment appetite, with 33.3% very willing and 30.3% willing. In contrast, smaller companies lean more toward moderate willingness, reflecting resource constraints.
- Room for growth in low-willingness segments: A small but notable portion of respondents (10.9%) rate their willingness as low (scores of 1 or 2), with the majority concentrated in smaller organizations or resource-constrained functions like Sales. Addressing these gaps with cost-effective or ROI-driven solutions could improve adoption.
Detailed Insights: Willingness to Invest
The survey reveals a strong overall willingness to invest in innovative strategies, with over 89% of respondents reporting at least moderate willingness (scores of 3, 4, or 5). This broad openness highlights a general interest in experimentation and growth within content marketing.
Certain roles exhibit particularly high enthusiasm for innovation. IT/Technology and Product Management stand out, with 50–75% of respondents in these groups rating themselves as "very willing" (score of 5). This alignment underscores the close relationship between technological advancements and their respective functions.
Mid-sized companies (51-200 employees) lead the way in investment appetite, with 33.3% reporting they are very willing and 30.3% reporting they are willing. In contrast, smaller companies tend to fall into the moderate willingness category, reflecting the impact of resource constraints on decision-making.
A small but significant group (10.9%) rates their willingness as low (scores of 1 or 2). These respondents are primarily from smaller organizations or resource-constrained functions like Sales. Addressing this reluctance with cost-effective or ROI-focused solutions could help bridge the gap and foster broader adoption of innovative strategies.
Willingness to Invest by Company Size
Respondents rated their willingness to invest in experimental or innovative content strategies on a scale of 1 (low) to 5 (high). Here’s the breakdown by company size:
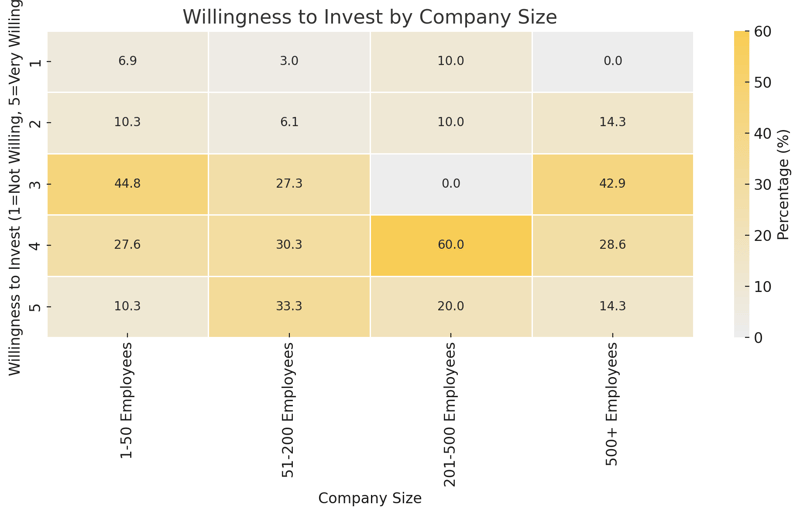
- 1-50 Employees:
- 3 (Moderately Willing): 44.8%
- 4 (Willing): 27.6%
- 2 (Somewhat Unwilling): 10.3%
- 5 (Very Willing): 10.3%
- 1 (Not Willing): 6.9%
- 51-200 Employees:
- 5 (Very Willing): 33.3%
- 4 (Willing): 30.3%
- 3 (Moderately Willing): 27.3%
- 2 (Somewhat Unwilling): 6.1%
- 1 (Not Willing): 3.0%
- 201-500 Employees:
- 4 (Willing): 60.0%
- 5 (Very Willing): 20.0%
- 1 (Not Willing): 10.0%
- 2 (Somewhat Unwilling): 10.0%
- 500+ Employees:
- 3 (Moderately Willing): 42.9%
- 4 (Willing): 28.6%
- 5 (Very Willing): 14.3%
- 2 (Somewhat Unwilling): 14.3%
Key Insights
- High willingness among mid-sized companies: Companies with 51-200 employees show the highest willingness to invest, with 33.3% rating "very willing" and 30.3% "willing."
- Smaller companies show caution: 1-50 employee companies lean toward moderate willingness (44.8%), reflecting resource constraints that limit high levels of investment.
- Large companies split between moderate and high: Among 500+ employee companies, 42.9% are moderately willing, but high willingness (scores of 4 and 5) is less frequent compared to mid-sized firms.
Detailed Insights: Company Size
The survey reveals notable variations in willingness to invest across company sizes, with mid-sized organizations leading. Companies with 51-200 employees exhibit the highest levels of willingness, with 33.3% rating "very willing" and 30.3% rating "willing." This strong appetite for innovation highlights their ability to balance resources and impact effectively.
Smaller companies (1-50 employees) tend to approach investment cautiously, with 44.8% showing moderate willingness. Their resource constraints likely play a significant role in limiting higher levels of investment, reflecting a need for more cost-effective solutions to overcome these barriers.
For larger companies (500+ employees), the data reveals a split between moderate and high willingness. While 42.9% report moderate willingness, the frequency of high willingness (scores of 4 and 5) is lower compared to mid-sized firms. This suggests that despite their resources, larger organizations may face internal complexities or slower decision-making processes that impact their investment readiness.
Willingness to Invest by Job Function
Respondents rated their willingness to invest in experimental or innovative content strategies on a scale of 1 (low) to 5 (high). Here’s the breakdown by job function:
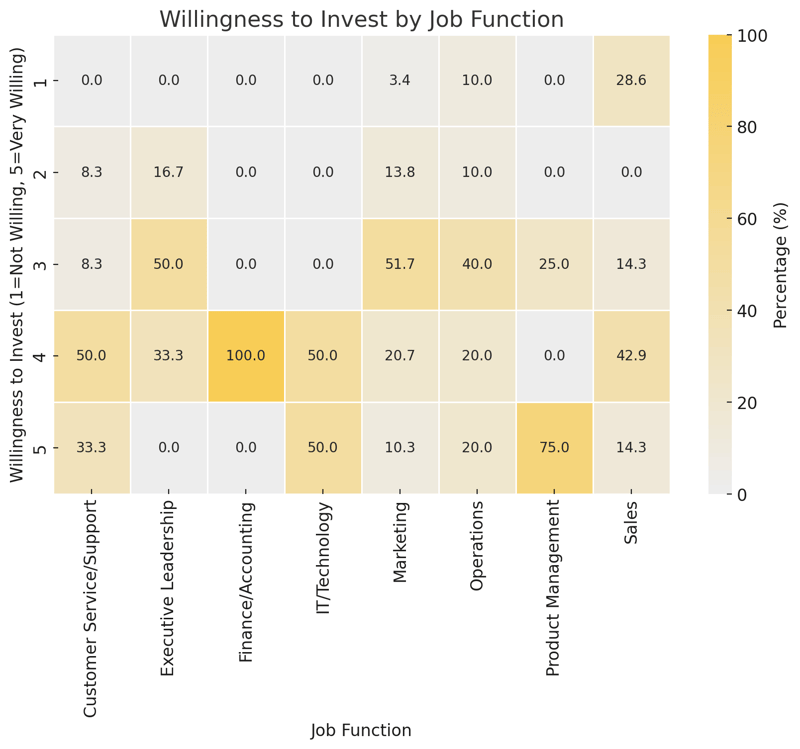
- Customer Service/Support:
- 4 (Willing): 50.0%
- 5 (Very Willing): 33.3%
- 2 (Somewhat Unwilling): 8.3%
- 3 (Moderately Willing): 8.3%
- Executive Leadership:
- 3 (Moderately Willing): 50.0%
- 4 (Willing): 33.3%
- 2 (Somewhat Unwilling): 16.7%
- Finance/Accounting:
- 4 (Willing): 100.0%
- IT/Technology:
- 4 (Willing): 50.0%
- 5 (Very Willing): 50.0%
- Marketing:
- 3 (Moderately Willing): 51.7%
- 4 (Willing): 20.7%
- 2 (Somewhat Unwilling): 13.8%
- 5 (Very Willing): 10.3%
- 1 (Not Willing): 3.4%
- Operations:
- 3 (Moderately Willing): 40.0%
- 4 (Willing): 20.0%
- 5 (Very Willing): 20.0%
- 1 (Not Willing): 10.0%
- 2 (Somewhat Unwilling): 10.0%
- Product Management:
- 5 (Very Willing): 75.0%
- 3 (Moderately Willing): 25.0%
- Sales:
- 4 (Willing): 42.9%
- 1 (Not Willing): 28.6%
- 3 (Moderately Willing): 14.3%
- 5 (Very Willing): 14.3%
Key Insights
- Strong willingness in IT and Product Management: Both IT/Technology and Product Management report the highest willingness to invest, with a 50%-75% rating of "very willing" (score of 5).
- Marketing’s moderate approach: A majority (51.7%) of marketing professionals are moderately willing, with fewer reporting high willingness (10.3% at "very willing").
- Diverse willingness in Sales: Sales shows significant variability, with 42.9% willing but a notable 28.6% not willing to invest in innovation.
Detailed Insights: By Job Function
The survey highlights distinct patterns of investment interest across professional roles, with IT and Product Management leading the charge. Both IT/Technology and Product Management report the highest levels of "very willing" (score of 5), ranging from 50%-75%. This strong enthusiasm aligns with their focus on leveraging technological advancements to drive results.
Marketing professionals display a more moderate approach, with a majority (51.7%) rating themselves as moderately willing, while fewer (10.3%) fall into the "very willing" category. This measured stance reflects a focus on balancing innovation with the practicalities of existing strategies.
Sales exhibits diverse investment levels, with 42.9% reporting they are willing, but a notable 28.6% indicating they are not willing to invest in innovation. This variability suggests that resource constraints or differing priorities may influence their readiness to embrace new approaches.
Willingness to Invest by Industry
Respondents rated their willingness to invest in experimental or innovative content strategies on a scale of 1 (low) to 5 (high). Here’s the breakdown by industry:
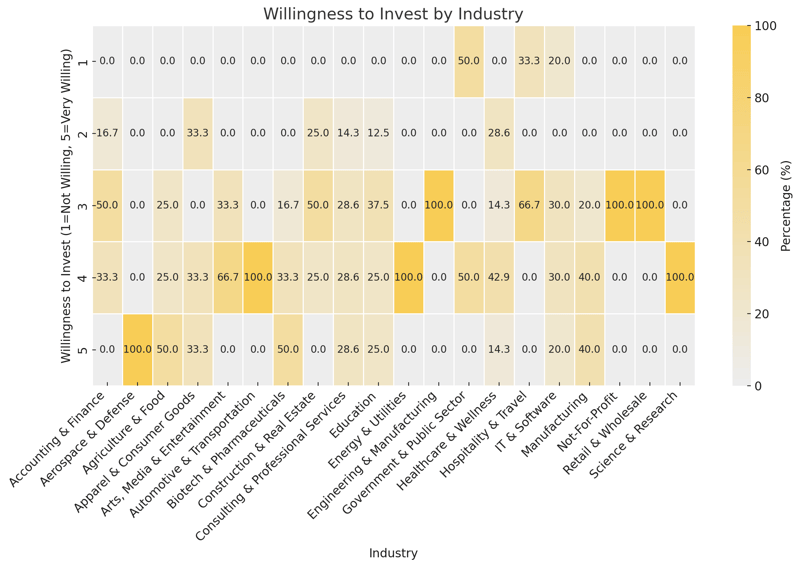
- Accounting & Finance:
- 3 (Moderately Willing): 50.0%
- 4 (Willing): 33.3%
- 2 (Somewhat Unwilling): 16.7%
- Aerospace & Defense:
- 5 (Very Willing): 100.0%
- Agriculture & Food:
- 5 (Very Willing): 50.0%
- 3 (Moderately Willing): 25.0%
- 4 (Willing): 25.0%
- Apparel & Consumer Goods:
- 2 (Somewhat Unwilling): 33.3%
- 4 (Willing): 33.3%
- 5 (Very Willing): 33.3%
- Arts, Media & Entertainment:
- 4 (Willing): 66.7%
- 3 (Moderately Willing): 33.3%
- Automotive & Transportation:
- 4 (Willing): 100.0%
- Biotech & Pharmaceuticals:
- 5 (Very Willing): 50.0%
- 4 (Willing): 33.3%
- 3 (Moderately Willing): 16.7%
- Construction & Real Estate:
- 3 (Moderately Willing): 50.0%
- 2 (Somewhat Unwilling): 25.0%
- 4 (Willing): 25.0%
- Consulting & Professional Services:
- 3 (Moderately Willing): 28.6%
- 4 (Willing): 28.6%
- 5 (Very Willing): 28.6%
- 2 (Somewhat Unwilling): 14.3%
- Education:
- 3 (Moderately Willing): 37.5%
- 4 (Willing): 25.0%
- 5 (Very Willing): 25.0%
- 2 (Somewhat Unwilling): 12.5%
- Energy & Utilities:
- 4 (Willing): 100.0%
- Engineering & Manufacturing:
- 3 (Moderately Willing): 100.0%
- Government & Public Sector:
- 1 (Not Willing): 50.0%
- 4 (Willing): 50.0%
- Healthcare & Wellness:
- 4 (Willing): 42.9%
- 2 (Somewhat Unwilling): 28.6%
- 3 (Moderately Willing): 14.3%
- 5 (Very Willing): 14.3%
- Hospitality & Travel:
- 3 (Moderately Willing): 66.7%
- 1 (Not Willing): 33.3%
- IT & Software:
- 3 (Moderately Willing): 30.0%
- 4 (Willing): 30.0%
- 1 (Not Willing): 20.0%
- 5 (Very Willing): 20.0%
- Manufacturing:
- 4 (Willing): 40.0%
- 5 (Very Willing): 40.0%
- 3 (Moderately Willing): 20.0%
- Not-For-Profit:
- 3 (Moderately Willing): 100.0%
- Retail & Wholesale:
- 3 (Moderately Willing): 100.0%
- Science & Research:
- 4 (Willing): 100.0%
Key Insights
- High willingness in Aerospace & Defense: 100% of respondents in Aerospace & Defense rated their willingness as "very willing" (score of 5).
- Balanced willingness in Biotech & Pharmaceuticals: A significant portion (50% very willing) shows strong enthusiasm, complemented by a smaller group with moderate willingness.
- Diverse willingness in IT & Software: Interest is split between moderate (30%) and high willingness (30% willing, 20% very willing), with a notable 20% not willing to invest.
- Lower willingness in Hospitality & Government: A significant portion of Hospitality & Travel (33%) and Government & Public Sector (50%) rated their willingness as "not willing" (score of 1), highlighting budget or risk concerns.
Detailed Insights: By Industry
The survey reveals varying levels of investment interest across industries, with notable enthusiasm in certain sectors. In Aerospace & Defense, 100% of respondents rated their willingness as "very willing" (score of 5), reflecting a strong commitment to innovation and advancement.
Biotech & Pharmaceuticals show balanced enthusiasm, with 50% rating themselves as "very willing" and the remaining respondents demonstrating moderate willingness. This indicates a mix of strong interest in innovation alongside cautious resource allocation.
IT & Software presents a diverse picture, with 30% reporting moderate willingness, 30% "willing," and 20% "very willing." However, another 20% are not willing to invest, signaling variability in readiness influenced by differing priorities or challenges within the sector.
In contrast, Hospitality & Travel and Government & Public Sector show lower interest, with 33% and 50%, respectively, rating their willingness as “not willing” (score of 1). These results likely stem from budget constraints or concerns about the risks associated with innovative investments.
Summary of Findings: Emerging Technologies
The survey highlights a growing enthusiasm for emerging technologies like automation (30.7%) and AI personalization (25.1%), driven by their ability to enhance efficiency and deliver tailored experiences. While adoption varies across industries and roles, the findings underscore the importance of aligning innovation with strategic priorities. Mid-sized companies and tech-focused roles exhibit the strongest willingness to explore new strategies, showcasing their readiness to lead the adoption of scalable solutions.
However, challenges persist. Lower interest in tools like blockchain (0.6%) and content for voice search (6.1%) reflects skepticism toward technologies with niche applications or uncertain ROI. Similarly, the cautious approach of smaller companies and resource-constrained industries highlights the need for cost-effective tools and clear ROI demonstration.
Organizations that embrace education, collaboration, and accessible technologies will be best positioned to bridge these gaps. By prioritizing tools that drive measurable outcomes and tailoring strategies to their unique needs, businesses can confidently leverage innovation to stay competitive.
What This Means For You
- Leverage Popular Technologies for Efficiency and Personalization
With automation (30.7%) and AI-driven personalization (25.1%) leading interest, organizations can prioritize these tools to streamline operations and offer tailored user experiences. Start by assessing areas where automation can save time, such as content distribution, and where AI can enhance customer engagement through personalization. - Adopt Real-Time Optimization for Agile Strategies
Interest in real-time content optimization (21.8%) underscores the growing need for adaptability in content marketing. By investing in tools that track performance in real-time, you can adjust strategies dynamically to improve outcomes, ensuring your campaigns remain relevant and effective. - Approach Emerging Formats Strategically
Technologies like virtual/augmented reality (15.6%) and content for voice search (6.1%) show moderate to limited appeal, highlighting the need for careful consideration of ROI before investing. Focus on these tools if they align with your audience's preferences or industry-specific use cases, such as immersive training or enhanced search experiences. - Bridge Industry and Role-Specific Gaps
Adoption trends vary across industries and roles, with Customer Service and IT/Technology favoring VR (23.1% and 31.8%), while Sales prioritizes real-time optimization (33.3%). Tailor technology investments to the unique needs of your team, ensuring tools align with departmental objectives and industry demands. - Invest Based on Company Size and Resources
Mid-sized companies (51-200 employees) show the highest willingness to invest, with 33.3% very willing, reflecting their ability to balance resources and innovation. Smaller organizations should focus on cost-effective tools, while larger firms can experiment with high-impact solutions while strengthening ROI tracking to justify investments. - Prioritize Cost-Effective and Scalable Solutions
The lower willingness among smaller companies (44.8% moderately willing) and resource-constrained industries highlights the importance of accessible technologies. Focus on scalable tools that can deliver measurable results without requiring significant upfront investment, ensuring that innovation is achievable for all. - Address Reluctance with Clear ROI Demonstrations
Technologies like blockchain (0.6%) and voice search content (6.1%) face skepticism due to unclear ROI. To foster adoption, prioritize pilot programs or smaller-scale implementations that provide measurable results, building confidence in these tools' potential. - Foster Collaboration Across Roles and Levels
IT and Product Management roles (50%-75% very willing) demonstrate the highest enthusiasm for innovation, while C-level executives (13% very willing) are more cautious. Bridging these gaps with clear, data-backed evidence can align teams, enabling unified decision-making and effective implementation of emerging technologies.
Qualitative Insights
Advice for B2B Companies
Common Themes:
Consistency and quality: Many respondents emphasized the importance of producing content regularly and maintaining high standards. A standout piece of advice was:-
-
- "The B2B marketing content should be consistent and relatable to the target audience." - Oliver Lyle
- “Consistency is everything...It might be hard, but it's worth it” - Miranda Neils
- "Don't use a one-size-fits-all approach – customization is key.” - J. Pinto, Odyssey Trust
-
-
-
- "Understanding your target well and producing informative and relatable content is key to success." - Melly Pius
- “Identify and discuss real-world challenges to help clients relate to your brand and develop interest. Aim for content that is truly useful to prospects; this strategy has proven successful.” - H. Warner, PayTrak Payroll Services & Software
- “Listen to your customers and get their feedback on your content.” - Collet, Actenum
- “Develop Buyer Personas: Understand who your ideal customers are, their roles, challenges, and goals. This ensures your content resonates with their needs. Focus on Decision-Makers: Tailor your content for key stakeholders, such as managers, procurement officers, or C-level executives." - Anonymous
-
-
-
- "Take advantage of AI wherever possible—let AI tools help with efficiency and personalization." - Samantha, Blue Link ERP
- “Use AI to help, but treat AI as if it is your employee. Give it detailed guidance, make edits appropriately, and try to leave the true creativity to the humans.” - Natalie, ClearPier
- “Review the tools that are now available and see which ones work best for your team.” - Aimee, Fluid-Aire Dynamics
-
-
-
- "It doesn’t need to be perfect. Content is an evolving process; experiment and adapt as needed." - Laura, SmartSkin Technologies
- “Be open to learning and trying new things. Staying internal will only get you so far - if you want to go further, invest in a company that can guide you and provide different perspectives/ideas to help your organization grow and meet its goals!” - L. MacMillan, University of Okanagan
- "Be open to experimenting and trying new techniques to improve content marketing effectiveness.” - Brooke, CMP Team
-
-
-
- "Focus on getting your content out in front of decision-makers—distribution is as important as creation." - J. Johnson, NetLine
- Quality over quantity - we are all inundated with blogs and social posts and offers of useless whitepapers all the time. Make it short and valuable and promise actions that can come out of it.” - Christine Bellefontaine
- “Create more engaging content and do so more frequently.” - E. Dobkin, Yedi
- “Keep on top of what your competitors are doing.” - S. Johnson, Odell HVAC
-
Key Insights
- Broad emphasis on basics: While technologies like AI were highlighted, many responses reaffirmed traditional content marketing principles such as understanding the audience and maintaining quality.
- Shift toward innovation: Several responses encouraged experimenting with new tools and formats, signaling a growing appetite for risk-taking in content strategies.
- Actionable advice: Suggestions to integrate AI and prioritize promotion indicate actionable areas where B2B marketers can improve efficiency and reach.
Detailed Insights
The qualitative responses from the survey provide valuable perspectives on the state of B2B content marketing, highlighting a mix of actionable advice, emerging challenges, and untapped opportunities. A recurring theme is the importance of consistency and audience understanding, with many respondents emphasizing the need for relatable, high-quality content tailored to specific audience needs. This aligns with a broader personalization trend in content marketing, underscoring the value of knowing your audience to build trust and engagement.
Several respondents showcased enthusiasm for AI and automation, advising others to explore these tools for greater efficiency and scalability. However, this optimism contrasts with feedback from companies still grappling with foundational challenges. Many noted their lack of direction in adopting new tools or strategies, with comments like "we don’t know where to start" and "we are getting there—but not quite there." This suggests a maturity gap, where companies at different stages of content strategy development face divergent challenges.
Time and resource constraints were prevalent across responses, particularly in open-text explanations for challenges. Statements such as "time is our biggest barrier" and "we wish we had capacity to vary things" highlight how limited resources can stifle creativity and experimentation. Despite this, some companies are finding innovative ways to adapt. Mentions of short-form videos, LinkedIn takeovers, and earned media placements indicate a willingness to experiment with dynamic formats and unconventional approaches, even amid constraints.
The "Other" responses also shed light on untapped or underutilized metrics and strategies. Metrics like email engagement data and sales account activity were highlighted as success indicators, emphasizing the importance of actionable, measurable outcomes. However, the absence of tools or clear strategies in some cases reflects a need for greater education and accessibility in content marketing best practices.
Conclusion: Insights and Next Steps for B2B Content Marketing Success
This report sheds light on the state of B2B content marketing, providing actionable insights for organizations seeking to refine their strategies and stay ahead of the curve. By analyzing survey data across industries, job functions, company sizes, and seniority levels, we’ve uncovered trends, challenges, and opportunities that reflect the current and future state of content marketing.
Key Takeaways
- A focus on goals: The primary content marketing goals of lead generation, brand awareness, and supporting sales remain consistent across most organizations. However, industries and job functions approach these goals with varying strategies, underscoring the importance of customization.
- Challenges and resource gaps: Generating high-quality leads, producing engaging content, and measuring ROI remain pervasive challenges. These obstacles highlight the need for innovative tools, cross-department collaboration, and better alignment between strategy and execution.
- Technological transformation: Advanced automation and AI-driven personalization reshape how B2B companies engage their audiences. However, many organizations are still in the early stages of adopting emerging technologies, revealing opportunities for growth and competitive differentiation.
- Willingness to invest: The willingness to experiment and invest in new content strategies varies widely by industry, company size, and role. Organizations with a strong appetite for innovation, particularly mid-sized firms and IT leaders, are well-positioned to leverage cutting-edge tools for maximum impact.
Next Steps for Marketing Leaders
- Evaluate your goals and challenges: Use this report to benchmark your organization’s priorities and hurdles against industry trends. Identify gaps in your strategy, whether it’s generating leads, nurturing prospects, or improving ROI measurement.
- Leverage emerging technologies: Prioritize adopting technologies like AI-driven personalization, real-time optimization, and automation. Start small by testing these tools in specific campaigns, then scale as you demonstrate ROI.
- Invest in education and resources: Address gaps in in-house expertise and resource limitations by investing in team training, external consultants, or scalable content tools. Collaboration with cross-functional teams will further strengthen your efforts.
- Experiment and measure: Be willing to experiment with new formats, channels, and technologies. Develop robust tracking systems to measure the effectiveness of these initiatives and refine them based on data.
- Focus on distribution: While creating high-quality content is critical, ensuring it reaches the right audience is equally important. Enhance your content distribution strategies through targeted advertising, social media, and email campaigns.
How to Leverage This Report
- Benchmarking: Compare your organization’s approach to the survey findings to identify areas for improvement or opportunities to lead in your industry.
- Strategic planning: Use the insights to inform your annual or quarterly marketing plans, ensuring alignment with broader business objectives.
- Team alignment: Share these findings with cross-functional teams to align goals, reduce silos, and improve collaboration between marketing, sales, and operations.
- Technology adoption: Consider the highlighted trends to prioritize tools and strategies gaining traction across industries, ensuring your organization stays competitive.
Looking Ahead
B2B content marketing continues to evolve, requiring organizations to adapt quickly and strategically. This report serves as both a mirror and a guide—reflecting the current state of content marketing while pointing toward actionable pathways for growth and success. The organizations that thrive will embrace innovation, invest in their people, and remain agile in the face of change.
Thank you for reading this report. We hope it serves as a valuable resource as you refine and optimize your content marketing efforts. Let’s shape the future of B2B content marketing together.
Ready to Transform Your Content Marketing Strategy?
At ThinkFuel, we specialize in helping B2B companies like yours unlock the full potential of their content marketing efforts. Whether you’re looking to generate high-quality leads, optimize your ROI, or adopt cutting-edge technologies, our team of experts is here to guide you every step of the way.
As a trusted digital marketing agency and top-tier HubSpot Partner, we have the tools, expertise, and proven strategies to drive measurable results. Let’s collaborate to create a tailored approach that aligns with your unique goals and sets your business apart in a competitive market.
Here’s how we can help you:
- Content Marketing Strategy: Develop a data-driven plan that engages your audience and achieves your objectives.
- HubSpot Optimization: Maximize your HubSpot investment with customized onboarding, training, and ongoing support.
- Lead Generation Campaigns: Drive targeted traffic and convert it into high-value leads that fuel your growth.
Let’s Get Started Today. Schedule a free consultation with ThinkFuel today. Together, we can turn insights into action and take your marketing to the next level.
ThinkFuel: Where Strategy Meets Results.
Contributors:

Kevin D'Arcy
From Our Blog
Stay up to date with what is new in our industry, learn more about the upcoming products and events.

What Is HubSpot Revenue Hub? And Why Revenue Teams Should Be Paying Attention

How AI Is Rewiring Enterprise Revenue Operations